
How Much Do BPO Services Cost in 2026? Complete Pricing Guide, AI vs. Human Support Analysis, and India’s Best BPO Companies Compared
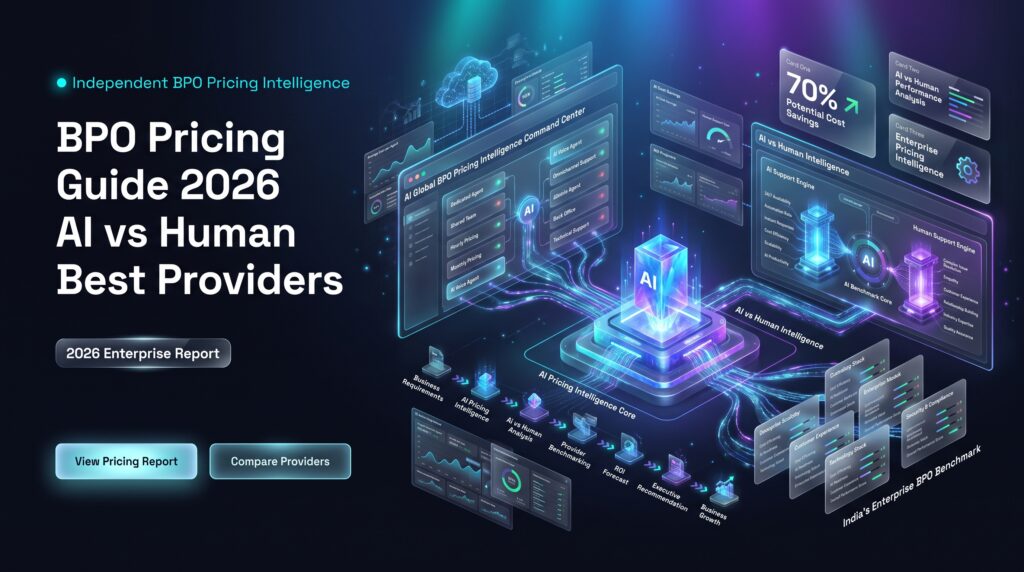
AI Overview
BPO pricing in 2026 is structured around four models: per-agent (FTE), per-transaction, outcome-based, and hybrid AI+human. Costs vary by region (India: $8–$18/hour blended; Philippines: $10–$20/hour; Eastern Europe: $15–$28/hour; US/UK onshore: $28–$55/hour), by channel (voice > chat > email in cost), and by AI adoption (AI-first triage can cut per-ticket cost by 40–60%). The real cost of outsourcing customer support isn’t the invoice — it’s the revenue lost or recovered based on how well the outsourced function performs. Buyers evaluating BPO partners should weigh total cost of ownership, not hourly rate, and assess AI maturity, compliance readiness, and outcome accountability before signing.
Executive Introduction
Every CFO who has reviewed a BPO contract has asked the same question: “Why does this quote look so different from the last three we received?”
The honest answer is that BPO pricing in 2026 is no longer a commodity calculation. It used to be simple — count the agents, multiply by an hourly rate, add a management fee. That model is dying, and any vendor still pricing that way is quoting you for 2019, not 2026.
Today, the cost of a BPO engagement is shaped by three forces that didn’t exist a decade ago: AI-augmented service delivery, outcome-based commercial models, and the direct link between support quality and revenue retention. This is the foundation of what we call Revenue Recovery Through CX™ — the principle that customer experience is not a cost center to be minimized, but a revenue-protection function whose ROI can be measured, forecast, and optimized like any other business investment.
This guide exists because most “BPO pricing” content online is either vendor marketing dressed up as education, or generic listicles with no operational depth. What follows is different: a pricing framework built from what we actually see inside outsourcing programs — the invoices, the SLA renegotiations, the hidden costs that show up in month four, and the AI vs. human decisions that determine whether a support function protects revenue or quietly bleeds it.
If you are a CEO, COO, CX leader, or procurement executive evaluating whether to outsource, re-negotiate, or restructure your customer support operation in 2026, this is built for you.
Key Insights
- BPO pricing has shifted from labor arbitrage to intelligence arbitrage. The cheapest provider by hourly rate is rarely the cheapest by total cost of ownership.
- AI vs. human customer support is not an either/or decision. The highest-performing 2026 operations run hybrid models where AI resolves 40–65% of volume and humans own complexity, empathy, and revenue-sensitive conversations.
- India remains the most cost-efficient geography for English-language support, but the “best BPO companies in India” in 2026 are differentiated by AI infrastructure and compliance maturity, not headcount size.
- Hidden costs — not base rates — determine whether outsourcing succeeds. Attrition-driven retraining, escalation mishandling, and poor knowledge transfer routinely erase 15–25% of projected savings.
- Support-Led Revenue Growth™ is measurable: organizations that treat contact center data as a business intelligence asset see measurable lifts in retention and forecast accuracy, not just cost reduction.
- Outcome-based pricing models are becoming the enterprise standard, replacing pure per-hour billing, especially in collections, retention, and technical support.
- Buyers who evaluate vendors on automation readiness, data security, and escalation governance — not just price per seat — consistently report higher CSAT and lower total cost per resolved ticket.
Market Reality: The State of BPO in 2026
The global BPO and contact center outsourcing market has crossed $500B+ in annual spend, but the composition of that spend has changed fundamentally. Three years ago, over 70% of contact center outsourcing budgets went to pure headcount. In 2026, industry data suggests 35–40% of budgets now go toward AI infrastructure, automation licensing, and hybrid workforce enablement layered on top of human agents.
This shift is not cosmetic. It reflects a deeper truth: enterprises finally understand that every customer interaction — whether handled by a bot or a human — is a data point that can be captured, analyzed, and converted into revenue intelligence. This is the essence of Contact Center Intelligence™ — treating the millions of conversations flowing through a support operation as a structured, reusable business asset rather than a disposable cost of doing business.
What’s driving the pricing shift:
- Generative AI in tier-1 support. Large language models (OpenAI, Google Gemini, Claude, Microsoft Copilot) are now embedded directly into ticketing and voice platforms, reducing average handle time by 20–35% on repetitive queries.
- Outcome-based commercial models. Enterprises are pushing BPOs toward pricing tied to resolution rate, retention, or recovered revenue — not seat count.
- Compliance-driven cost increases. HIPAA, PCI-DSS, GDPR, and RBI data-localization requirements have raised the cost floor for compliant providers, widening the gap between “cheap” and “compliant.”
- Talent competition in India and the Philippines. Wage inflation in tier-1 outsourcing hubs (Delhi NCR, Bangalore, Manila, Cebu) has pushed blended rates up 8–12% year-over-year.
Boardroom Insight: Most executives still benchmark BPO cost against last year’s contract. That’s the wrong anchor. The right anchor is cost-per-resolved-outcome relative to revenue impact — and by that measure, the “expensive” AI-augmented vendor is frequently the cheaper option in Q4.
Key Takeaway: BPO pricing in 2026 rewards buyers who evaluate total value delivered per dollar, not the lowest hourly quote on the table.
What Are BPO Services?
Direct Answer: Business Process Outsourcing (BPO) services refer to the delegation of specific business functions — most commonly customer support, technical support, collections, back-office processing, and now AI-assisted operations — to a third-party provider that operates as an extension of the client’s team, typically at lower cost and higher scalability than an in-house equivalent.
Why It Matters
Outsourcing decisions in 2026 aren’t just about cost arbitrage anymore — they’re about capacity, speed-to-scale, and access to AI infrastructure that most mid-market and even enterprise companies cannot build internally at the same cost or speed.
How It Works
A modern BPO engagement typically includes:
- Voice support (inbound/outbound, IVR, voice AI)
- Digital support (chat, email, social, WhatsApp Business API)
- Back-office processing (data entry, claims processing, order management)
- Technical support (Tier 1–3, software troubleshooting)
- Collections and retention
- AI-augmented triage and agent-assist layers
Framework: The Three Layers of a 2026 BPO Engagement
| Layer | Function | Typical Cost Share |
|---|---|---|
| Human Delivery Layer | Agents, team leads, QA, trainers | 55–65% of total cost |
| Technology Layer | CRM, telephony, AI/automation licensing | 20–30% of total cost |
| Intelligence Layer | Analytics, QA scoring, conversation intelligence | 10–15% of total cost |
Executive Interpretation: If your BPO quote has no line item for the “Intelligence Layer,” you are buying 2019-style outsourcing at a 2026 price. This layer is where Contact Center Intelligence™ lives — the analytics and conversation data that convert your support operation from a cost center into a forecasting and retention asset.
Summary: BPO in 2026 is a three-layer system — people, technology, and intelligence — and pricing should reflect investment across all three, not headcount alone.
Key Takeaway: If a vendor can’t explain what’s happening in the technology and intelligence layers of their pricing, you’re evaluating an incomplete quote.
BPO Pricing Models: How Providers Actually Price Their Services
Understanding pricing models is the single highest-leverage thing a buyer can do before requesting quotes. Most RFP processes fail because buyers compare rates across fundamentally different pricing structures — an apples-to-oranges error that leads to bad vendor selection.
The Four Dominant Pricing Models in 2026
| Model | How It Works | Best For | Typical Range |
|---|---|---|---|
| Per-Agent (FTE) Pricing | Fixed monthly cost per dedicated agent | Predictable, high-volume operations | $900–$1,800/agent/month (India) |
| Per-Transaction/Per-Ticket | Cost per resolved ticket, call, or chat | Variable volume, seasonal businesses | $0.80–$6 per ticket |
| Outcome-Based Pricing | Fees tied to resolution rate, retention, or recovery | Collections, retention, revenue-sensitive support | 8–20% of recovered/retained value |
| Hybrid AI + Human Pricing | Blended fee covering AI resolution + human escalation | Enterprises optimizing cost-to-serve | $0.40–$2.50 per AI-resolved interaction + human agent cost |
Boardroom Insight: Outcome-based pricing sounds attractive to CFOs, but it only works when the BPO has direct control over the variables driving the outcome (script, escalation authority, tooling access). If your vendor can’t touch the CRM or make policy exceptions, outcome-based pricing shifts risk onto you, not them. Read the operating model before you read the rate card.
Practical Recommendation: Request quotes in at least two pricing models from every shortlisted vendor. The comparison itself reveals which providers understand your actual cost drivers versus which are reverse-engineering a number to win the deal.
Global BPO Cost Benchmarks by Region (2026)
| Region | Blended Hourly Rate | Agent/Month (Dedicated) | Language Strength | Typical Use Case |
|---|---|---|---|---|
| India | $8–$18 | $900–$1,800 | English, multilingual (Hindi, regional) | Voice, chat, technical support, back-office |
| Philippines | $10–$20 | $1,000–$1,900 | Neutral English accent | Voice-heavy US/UK support |
| Eastern Europe (Poland, Romania) | $15–$28 | $1,800–$3,200 | Multilingual European | EU-based support, GDPR-sensitive ops |
| Latin America (Colombia, Mexico) | $12–$22 | $1,300–$2,400 | Spanish/English bilingual | US Hispanic market, nearshore for US East Coast |
| US/UK Onshore | $28–$55 | $4,000–$7,000 | Native | Compliance-heavy, high-empathy escalations |
Why It Matters: A 3–5x cost differential exists between onshore and offshore delivery for functionally similar work. The gap has narrowed slightly due to wage inflation in India and the Philippines, but it remains the single largest lever available to CFOs seeking cost-to-serve reduction without compromising coverage hours.
Hidden Cost: Rate cards rarely disclose shrinkage — the gap between paid hours and productive hours (training, breaks, attrition backfill, absenteeism). Effective shrinkage in offshore centers typically runs 28–35%, meaning your real cost per productive hour is materially higher than the quoted rate. Always ask vendors for their shrinkage-adjusted effective rate, not the headline number.
Key Takeaway: Compare shrinkage-adjusted effective cost per productive hour — not headline hourly rates — when benchmarking BPO vendors across regions.
Cost by Channel: Voice, Chat, Email, and AI-First Support
| Channel | Cost per Interaction | Automation Potential | Notes |
|---|---|---|---|
| Voice (inbound) | $2.50–$8.00 | Low–Medium | Highest cost; hardest to automate fully |
| Live Chat | $1.20–$4.50 | Medium–High | Agents can handle 2–4 concurrent chats |
| Email/Ticket | $0.90–$3.50 | High | Well-suited to AI drafting + human review |
| AI Chatbot/Voicebot (Tier 1) | $0.10–$0.80 | Very High | Best for FAQs, order status, appointment scheduling |
| Hybrid (AI triage + human escalation) | $0.60–$2.20 blended | High | Emerging standard for 2026 operations |
MasCallNet Perspective: The organizations getting this wrong aren’t choosing the wrong channel — they’re applying a single cost model across all channels instead of routing intelligently. A returns question doesn’t need a human. A churn-risk complaint from a high-LTV customer should never touch a bot first. Channel-cost optimization is really a routing intelligence problem, not a staffing problem.
Executive Action: Audit your last 90 days of ticket volume by category and ask: which of these should have been AI-resolved, and which were incorrectly routed to AI when they needed a human? Most operations we assess find 15–20% of tickets are misrouted in one direction or the other — and both directions cost money, just differently.
AI vs. Human Customer Support: The 2026 Decision Framework
This is the question every CX and operations leader is now forced to answer, and it deserves more nuance than the binary framing usually applied.
Direct Answer
AI customer support costs 60–90% less per interaction than human support and excels at speed, availability, and repetitive-query resolution. Human support costs more but delivers superior outcomes in complex, emotional, high-stakes, or revenue-sensitive conversations. The highest-performing 2026 operations don’t choose one — they architect a hybrid model where AI absorbs volume and humans own value.
Why It Matters
Getting this allocation wrong in either direction is expensive. Over-automate, and you erode CSAT, increase escalations, and lose customers who feel unheard. Over-staff with humans, and you carry unnecessary cost structure that competitors running leaner hybrid models will exploit on price and speed.
The AI vs. Human vs. Hybrid Model™
| Dimension | AI-First | Human-First | Hybrid (Recommended) |
|---|---|---|---|
| Cost per interaction | $0.10–$0.80 | $2.50–$8.00 | $0.60–$2.20 blended |
| Availability | 24/7/365, instant | Shift-dependent | 24/7 with escalation coverage |
| Resolution quality (complex issues) | Low | High | High (routed appropriately) |
| Empathy/emotional intelligence | Very low | High | High (AI screens, human owns emotion) |
| Scalability during spikes | Instant, near-infinite | Constrained by hiring/training | Elastic |
| Revenue-sensitive conversations (retention, upsell, complaints) | Poor fit | Strong fit | Strong fit with AI-surfaced context |
| Consistency/compliance adherence | Very high | Variable | High |
| Data capture for analytics | Structured, complete | Inconsistent unless QA’d | Structured + human nuance |
Framework — The 40/30/30 Allocation Model:
Based on patterns across the operations we’ve assessed, a workable starting allocation for most mid-to-large support functions is:
- ~40% of volume: Fully AI-resolved (FAQs, order status, appointment scheduling, password resets, policy lookups)
- ~30% of volume: AI-assisted, human-finalized (agent-assist drafting responses, summarizing context, suggesting resolutions)
- ~30% of volume: Fully human-owned (complaints, retention conversations, high-value accounts, regulatory-sensitive issues, anything involving compensation or exceptions)
Boardroom Insight: The mistake most leadership teams make isn’t choosing AI or human — it’s letting the technology vendor decide the allocation instead of the business deciding it based on customer lifetime value and issue sensitivity. A $50 refund request and a $50,000 enterprise account renewal should never be routed through the same automation logic, yet in most organizations, they are.
What Everyone Says: “AI is replacing human agents.”
What Actually Happens: AI is replacing human time spent on low-value repetitive work, freeing agents for the 30% of conversations that actually determine retention and revenue. Headcount reduction is a byproduct, not the goal, in well-run hybrid transformations.
Hidden Cost: Poorly implemented AI deflection (forcing customers through bots before allowing human contact) is a leading — and rarely measured — driver of silent churn. Customers don’t always complain; they just don’t renew. This is the core mechanism behind what we call the MasCallNet Revenue Leakage Model™, detailed below.
Executive Recommendation: Don’t ask “should we use AI or humans?” Ask “what percentage of our contact volume is emotionally or financially significant enough to require human ownership?” Price your model around that answer, not around headline automation percentages vendors like to advertise.
Key Takeaway: The winning 2026 model isn’t AI vs. human — it’s AI-for-volume, human-for-value, connected through a shared intelligence layer.
Organizations exploring this transition often start with our customer support outsourcing framework, which is built specifically around this hybrid allocation model rather than a pure headcount replacement approach.
The MasCallNet Revenue Leakage Model™
Definition: A diagnostic framework that quantifies revenue lost due to poor support experiences — including unresolved tickets, slow response times, escalation mishandling, and misapplied AI deflection — that never show up on a P&L line item labeled “customer support cost.”
Methodology: The model tracks five leakage points across the customer journey: first-response delay, resolution failure rate, repeat-contact rate, escalation mishandling, and silent churn following a poor interaction.
Scoring Logic:
| Leakage Point | Weight | Data Source |
|---|---|---|
| First Response Time > SLA | 20% | Ticketing system timestamps |
| Repeat Contact within 7 days | 25% | CRM contact history |
| Escalation Mishandling Rate | 20% | QA scoring + escalation logs |
| CSAT Score post-resolution | 20% | Post-interaction surveys |
| Churn within 30 days of negative interaction | 15% | CRM + billing data correlation |
Each factor is scored 0–100 and weighted to produce a composite Revenue Leakage Index between 0 (no leakage) and 100 (severe leakage).
Interpretation:
- 0–25: Well-optimized support function; leakage is minimal.
- 26–50: Moderate leakage; likely losing 3–7% of at-risk revenue annually.
- 51–75: Significant leakage; support is actively damaging retention.
- 76–100: Support function is a revenue liability requiring immediate structural intervention.
Executive Recommendation: Most companies have never measured this number. Before negotiating your next BPO contract or evaluating an AI deployment, calculate your baseline Revenue Leakage Index. It reframes the entire pricing conversation — a $200,000 support budget that’s leaking $1.2M in preventable churn is not a $200,000 decision.
MasCallNet Perspective: This is the practical mechanism behind Revenue Recovery Through CX™ — it’s not a slogan, it’s a measurable before/after delta we track with clients across implementation.
Key Takeaway: The true cost of a support function isn’t its budget — it’s its budget plus its leakage index converted into lost revenue.
MasCallNet Outsourcing Readiness Score™
Definition: A pre-engagement diagnostic that determines whether an organization is operationally ready to outsource without introducing new risk.
Framework — Six Readiness Pillars:
| Pillar | Key Question | Weight |
|---|---|---|
| Documentation Maturity | Are SOPs and knowledge bases current and centralized? | 20% |
| Data & Systems Access | Can a third party securely access CRM/ticketing without compliance risk? | 20% |
| Escalation Governance | Is there a clear model for what agents can and cannot decide independently? | 15% |
| Volume Predictability | Is demand forecastable enough to size a team accurately? | 15% |
| Quality Benchmarks | Do you have existing CSAT/FCR baselines to hold a vendor accountable to? | 15% |
| Executive Sponsorship | Is there a named internal owner accountable for the outsourcing relationship? | 15% |
Scoring: Each pillar scored 1–5. Total score /30, converted to a readiness percentage.
- 80%+: Ready to outsource immediately; focus RFP on vendor capability.
- 60–79%: Ready with conditions; fix documentation/governance gaps first.
- Below 60%: Outsourcing now will likely underperform regardless of vendor quality — fix internal readiness first.
Common Executive Mistake: Signing a BPO contract to “fix” a support function that has no documented processes. Outsourcing amplifies whatever operating discipline already exists — good or bad. A vendor cannot fix undocumented chaos; they can only inherit it at scale.
What High-Performing Organizations Do Differently: They spend 4–6 weeks on internal readiness before issuing an RFP — building a knowledge base, defining escalation tiers, and setting quality baselines — and as a result, their outsourcing transitions go live in half the time with a fraction of the early-stage error rate.
Practical Recommendation: Run this scorecard internally before requesting vendor quotes. It also functions as leverage in negotiation — a well-documented, high-readiness organization should command better pricing and SLAs than a chaotic one, and most vendors will acknowledge this openly.
MasCallNet Vendor Evaluation Matrix™
Choosing among the best BPO companies in India — or anywhere — requires structured comparison, not a gut-feel decision based on the sales deck with the best design.
| Evaluation Criterion | Weight | What to Actually Verify |
|---|---|---|
| AI/Automation Infrastructure | 20% | Live demo of AI-assist tools, not slideware |
| Data Security & Compliance | 20% | ISO 27001, SOC 2, GDPR/HIPAA readiness, data residency |
| Industry Experience | 15% | Reference clients in your specific vertical |
| Pricing Transparency | 15% | Full cost breakdown including tech, QA, management fees |
| Scalability & Attrition Management | 15% | Historical attrition rate, backup staffing plan |
| Quality Governance | 15% | QA methodology, calibration process, reporting cadence |
Vendor Scorecard Template (Use for Every Shortlisted Vendor):
| Vendor | AI Infra (0-20) | Security (0-20) | Experience (0-15) | Pricing Transparency (0-15) | Scalability (0-15) | QA Governance (0-15) | Total (0-100) |
|---|---|---|---|---|---|---|---|
| Vendor A | |||||||
| Vendor B | |||||||
| Vendor C |
Boardroom Insight: The vendors who resist filling out a structured scorecard like this — offering only a generic proposal instead — are telling you something important about how they’ll behave during a contract renegotiation.
What Actually Happens in India-Based BPO Selection: Most procurement teams shortlist based on size and brand recognition, assuming larger means safer. In practice, mid-sized, AI-forward providers in hubs like Delhi NCR and Bangalore frequently outperform larger legacy BPOs on responsiveness, customization, and technology adoption speed — because they aren’t retrofitting AI onto twenty-year-old operating models. Read more in our BPO case studies India for documented outcomes across engagement sizes.
Key Takeaway: Score every vendor against the same six criteria before price enters the conversation — price should be the last filter, not the first.
Best BPO Companies in India: What “Best” Actually Means in 2026
Search results are full of “Top 10 BPO Companies in India” listicles ranked by company size or arbitrary criteria. That’s the wrong lens for a buyer making a real decision in 2026.
What Everyone Says
“Bigger BPO = safer choice.”
What Most Articles Miss
Scale doesn’t correlate with AI maturity, industry specialization, or CX outcomes. Many large legacy BPOs are still running human-only, script-heavy models with automation bolted on for marketing purposes rather than architected into the operating model.
What Actually Happens
The BPO companies producing the strongest client outcomes in India today share five characteristics regardless of company size:
- Native AI integration — not a chatbot widget, but AI embedded in agent workflows, QA, and routing.
- Vertical specialization — deep operating knowledge in specific industries (healthcare, fintech, eCommerce) rather than generalist coverage.
- Transparent, outcome-linked pricing — willingness to tie a portion of fees to measurable outcomes.
- Compliance-first infrastructure — data residency, encryption, and access controls built in, not added on request.
- Named account governance — a real accountable point of contact, not a rotating account manager.
MasCallNet Perspective: India’s advantage was never just labor cost — it’s the combination of English proficiency, technical talent density, and now, AI infrastructure maturity that lets Indian providers deliver enterprise-grade hybrid operations at a fraction of onshore cost. This is why our AI-powered BPO company India model is built around embedding automation into the operating layer from day one, not retrofitting it after go-live.
Executive Action: When evaluating “best BPO companies in India,” request a live walkthrough of their AI-assist tooling and a sample QA scorecard before requesting pricing. Providers unwilling to show this transparently are optimizing for the sale, not the relationship.
The India Advantage: Why It Still Matters in 2026
| Factor | Detail |
|---|---|
| Cost Efficiency | 3–5x lower cost-to-serve vs. US/UK onshore, even after wage inflation |
| English Proficiency | Largest English-speaking talent pool globally outside the US/UK |
| Technical Talent Density | Strong overlap between IT/engineering talent pool and CX/support operations, enabling faster AI adoption |
| Time Zone Coverage | Enables true 24/7 coverage when paired with US/EU shifts |
| Infrastructure Maturity | Tier-1 cities offer enterprise-grade data centers, redundant connectivity, ISO/SOC-certified facilities |
| Regulatory Familiarity | Growing expertise in HIPAA, PCI-DSS, GDPR-aligned operations for global clients |
Hidden Cost: Many buyers evaluate only Tier-1 city providers (Delhi NCR, Mumbai, Bangalore) due to brand familiarity, while overlooking the fact that wage inflation has compressed the cost advantage in these specific hubs. Emerging hubs and specialized mid-sized providers operating from Noida and similar NCR micro-markets often deliver comparable talent quality at a more favorable cost structure — worth direct comparison rather than assumption. Our Call Center in Noida operation is a direct example of this dynamic.
Key Takeaway: India’s outsourcing advantage in 2026 is no longer just about cost — it’s about the speed at which Indian providers are integrating AI into service delivery relative to global peers.
Case Study: From Cost Center to Revenue Recovery
Challenge:
A mid-sized US healthcare provider network was running patient support and appointment scheduling in-house, with a 12-person team handling roughly 8,000 monthly contacts. Average hold time exceeded 6 minutes, no-show rates for scheduled appointments were running at 22%, and the internal team was operating at 140% of budgeted headcount cost due to overtime and attrition-driven retraining.
Root Cause:
Diagnostic review (using a framework equivalent to the Revenue Leakage Model above) revealed the actual problem wasn’t staffing volume — it was a lack of automated reminder workflows, no AI-assisted call triage, and inconsistent scheduling confirmation processes, all of which compounded into abandoned calls and missed appointments (direct revenue loss for a healthcare provider billing per visit).
Solution:
A hybrid model was implemented: AI-driven appointment confirmation and reminder workflows handled routine scheduling and rescheduling (roughly 45% of total volume), a dedicated offshore team handled inbound patient queries and complex scheduling scenarios, and a conversation intelligence layer flagged compliance-sensitive calls for QA review.
Implementation:
Phased rollout over 8 weeks: Weeks 1–2 knowledge base and SOP standardization, Weeks 3–5 AI workflow deployment and agent training, Weeks 6–8 full transition with parallel-run QA against the legacy team.
Results:
- Average hold time reduced from 6+ minutes to under 90 seconds
- No-show rate reduced from 22% to 11%
- Total cost-to-serve reduced by 38% versus in-house baseline
- Estimated recovered revenue from reduced no-shows: approximately $340,000 annualized
Lessons Learned:
The client’s initial mandate was “reduce support costs.” The actual value delivered was overwhelmingly from revenue recovery — reduced no-shows — not labor arbitrage. This is the practical proof point behind Revenue Recovery Through CX™: the support function’s ROI was driven primarily by preventing revenue loss, not by cutting headcount cost.
Explore the operational model behind this transition in our healthcare BPO services guide, or learn more about patient appointment scheduling services specifically.
MasCallNet Cost Calculator™: Estimating Your True BPO Investment
Use this simplified framework to model your own cost-to-serve before requesting vendor quotes.
Formula:
Total Monthly Cost = (Agent Count × Blended Rate × Hours per Month)
                    + (Technology/AI Licensing Fee)
                    + (QA & Management Overhead, typically 10–15%)
                    + (Shrinkage Adjustment, typically 28–35%)
Worked Example — 20-Agent Hybrid Team, India-Based:
| Component | Calculation | Monthly Cost |
|---|---|---|
| Base Agent Cost | 20 agents × $10/hr × 190 hrs | $38,000 |
| AI/Automation Licensing | Fixed platform fee | $2,500 |
| QA & Management Overhead (12%) | On base agent cost | $4,560 |
| Shrinkage Adjustment (30%) | Effective productivity loss | +$11,400 equivalent |
| Estimated True Monthly Cost | ~$56,460 | |
| Estimated Cost per Ticket (8,000 tickets/month) | ~$7.05 |
Executive Interpretation: Most vendor quotes will show you the $38,000 base number. The true cost-to-serve, once technology, management, and shrinkage are factored in, is nearly 49% higher. Always request the fully-loaded number before comparing across vendors.
Practical Recommendation: Ask every vendor to complete this exact calculation format with their own numbers. Standardizing the format is the only way to make an apples-to-apples comparison across proposals.
MasCallNet AI Efficiency Index™
Definition: A scoring model that measures how effectively AI is deployed within a support operation — not just whether AI is present, but whether it’s improving cost and quality simultaneously.
Scoring Logic:
| Metric | Measurement | Weight |
|---|---|---|
| Deflection Accuracy | % of AI-resolved tickets with no repeat contact within 7 days | 30% |
| Escalation Precision | % of AI-to-human handoffs that included accurate context transfer | 25% |
| Cost per AI-Resolved Interaction | Benchmarked against category average | 20% |
| Customer Satisfaction on AI-Only Interactions | Post-interaction CSAT | 25% |
Interpretation: A high deflection rate with low deflection accuracy is a red flag — it means the AI is closing tickets, not resolving problems, which shows up later as repeat contacts and quiet churn. This index prevents vendors from marketing “80% automation” as a success metric when the real question is whether that automation is actually solving customer problems.
Executive Recommendation: Never accept “automation rate” as a standalone KPI in a vendor contract. Pair it contractually with a deflection accuracy or repeat-contact threshold.
CX Maturity Scorecard™
A maturity model to self-assess where your organization sits before choosing an outsourcing or AI strategy.
| Stage | Characteristics | Typical Cost-to-Serve Trend |
|---|---|---|
| Stage 1 – Reactive | No documented SOPs, fully human, no data capture | Highest cost, lowest predictability |
| Stage 2 – Structured | SOPs exist, basic CRM, some reporting | Moderate cost, improving predictability |
| Stage 3 – Augmented | AI-assist tools in place, hybrid routing begins | Cost declining, quality improving |
| Stage 4 – Intelligent | Full conversation intelligence layer, predictive routing, outcome-based vendor pricing | Lowest cost-to-serve, highest forecast accuracy |
| Stage 5 – Predictive | Support data feeds directly into retention/revenue forecasting models | Support function actively contributes to forecasting accuracy — Predictable Revenue Operations™ realized |
Boardroom Insight: Most organizations believe they’re at Stage 3. Independent assessment usually places them at Stage 2. This gap matters because vendors will price and propose solutions based on where you think you are, not where you actually are — leading to underperformance in the first 90 days.
Scalability Framework: Planning for Growth Without Overpaying
| Growth Scenario | Recommended Model | Why |
|---|---|---|
| Seasonal spikes (retail/eCommerce peak season) | Per-transaction pricing + flexible surge staffing | Avoids paying for idle dedicated headcount off-season |
| Steady, predictable growth | Dedicated FTE model with quarterly capacity reviews | Predictable cost, easier forecasting |
| Rapid, uncertain scale-up (startup/high-growth) | Hybrid AI-first with on-demand human overflow | Minimizes fixed cost commitment during uncertainty |
| New market/geography entry | Shared team model initially, transition to dedicated at volume threshold | Reduces upfront risk before demand is proven |
Our guide on how to scale customer support for 10,000+ monthly tickets walks through this transition threshold in detail.
Comparison Tables: The Decisions That Actually Matter
In-House vs. Outsourced
| Factor | In-House | Outsourced |
|---|---|---|
| Setup Speed | Slow (hiring, infra, training) | Fast (2–6 weeks typical) |
| Cost Predictability | Fixed overhead regardless of volume | Scales with volume |
| Control | Full | Shared, governed by SLA |
| Talent Access | Limited to local market | Access to global specialized talent pools |
| Best For | Highly regulated, brand-critical flagship support | Volume-driven, scalable, cost-sensitive operations |
Recommendation: Hybrid ownership — keep VIP/escalation tiers in-house, outsource volume tiers — is increasingly the enterprise standard.
Offshore vs. Onshore
| Factor | Offshore (India/Philippines) | Onshore (US/UK) |
|---|---|---|
| Cost | 3–5x lower | Highest |
| Time Zone Coverage | Excellent for 24/7 | Limited without shift premiums |
| Cultural/Accent Fit | Strong with training, some brands prefer neutral accent | Native fit |
| Compliance Complexity | Requires explicit data residency planning | Simpler for domestic-only compliance regimes |
Recommendation: Offshore for scale and cost efficiency; retain a small onshore escalation team for high-sensitivity brand moments.
Build vs. Buy
| Factor | Build (In-House AI/Ops) | Buy (Outsource to Specialized Partner) |
|---|---|---|
| Time to Value | 6–18 months | 4–8 weeks |
| Capital Requirement | High (infra, tooling, hiring) | Low (operational expense model) |
| Access to Latest AI Tooling | Requires ongoing internal R&D | Inherited from vendor’s platform investment |
Recommendation: Buy for speed and access to compounding AI infrastructure investment; build only when support is a core differentiator tied directly to product IP.
Dedicated Team vs. Shared Team
| Factor | Dedicated | Shared |
|---|---|---|
| Cost | Higher fixed cost | Lower, variable |
| Brand/Product Expertise Depth | Deep over time | Shallower, split attention |
| Best For | Complex products, high volume | Simple queries, low-to-mid volume, early-stage |
Traditional BPO vs. Contact Center Intelligence™
| Factor | Traditional BPO | Contact Center Intelligence™ Model |
|---|---|---|
| Primary Value Delivered | Labor cost reduction | Cost reduction + revenue/retention intelligence |
| Data Usage | Reporting for compliance only | Conversation data feeds forecasting, retention, product insight |
| Pricing Basis | Headcount/hourly | Outcome-linked, intelligence-inclusive |
| Executive Relevance | Operations-level decision | Board-level revenue and retention lever |
Executive Interpretation: This final comparison is the one most buyers haven’t been asked to make yet — because most vendors don’t operate at the “Intelligence” tier. It’s the difference between outsourcing a cost and investing in a revenue-protecting capability.
Industry Benchmarks: CSAT, FCR, AHT, and NPS by Sector
| Industry | Avg. CSAT | Avg. FCR | Avg. AHT (min) | Avg. NPS |
|---|---|---|---|---|
| Banking & Financial Services | 78% | 68% | 6.5 | 32 |
| Insurance | 74% | 61% | 8.2 | 24 |
| Retail & eCommerce | 82% | 71% | 4.8 | 41 |
| Healthcare | 76% | 64% | 7.1 | 29 |
| Telecommunications | 71% | 58% | 9.4 | 18 |
| Automotive/EV | 79% | 66% | 6.9 | 35 |
| Logistics | 75% | 63% | 5.5 | 27 |
(Benchmarks reflect industry-standard ranges compiled from public CX benchmarking reports and MasCallNet operational data across client engagements; actual performance varies by company size, channel mix, and support maturity stage.)
MasCallNet Perspective: Telecom’s low NPS/FCR combination is a structural industry problem, not a company-specific one — it reflects notoriously complex billing and technical issues resistant to first-contact resolution. Any BPO promising telecom-specific FCR above 75% without seeing your specific issue-type distribution first is overpromising.
ROI Framework: The MasCallNet Revenue Acceleration Framework™
Definition: A model for calculating the full return on a BPO/CX investment, incorporating cost savings, revenue recovery, and retention lift — not cost reduction alone.
Formula:
Total ROI = [(Cost Savings) + (Recovered Revenue from Reduced Churn)
            + (Revenue Lift from Improved Retention/Upsell Capture)]
            ÷ Total Investment in Outsourcing/CX Program
Worked Example:
| Component | Value |
|---|---|
| Annual Cost Savings (vs. in-house baseline) | $180,000 |
| Recovered Revenue (reduced churn, based on Leakage Index improvement) | $310,000 |
| Retention/Upsell Lift (from improved CX-driven cross-sell capture) | $95,000 |
| Total Value Delivered | $585,000 |
| Total Annual Investment | $220,000 |
| ROI | ~166% |
Executive Interpretation: Cost savings alone in this example would justify the investment (82% ROI). Including revenue recovery and retention lift more than doubles the calculated return — which is the number that should be presented to the board, not the cost-savings figure alone.
Boardroom Insight: If your current BPO business case is built entirely on cost savings, you are underselling the investment internally and setting up an unnecessarily defensive renewal conversation next year.
Industry Use Cases
| Industry | Primary Use Case | AI/Human Mix | Key Metric Impacted |
|---|---|---|---|
| Banking & Financial Services | Account inquiries, fraud alerts, digital banking services support | 50/50 hybrid | FCR, fraud response time |
| Insurance | Claims status, policy servicing, renewal retention calls | 40/60 hybrid | NPS, renewal rate |
| Retail & eCommerce | Order tracking, returns, WISMO (where is my order) | 65/35 AI-heavy | CSAT, cart recovery |
| FMCG | Distributor support, order management | 50/50 hybrid | Order accuracy, cycle time |
| Healthcare | Appointment scheduling, patient intake, billing queries | 45/55 hybrid | No-show rate, compliance adherence |
| Automotive/EV | Service scheduling, charging support (EV), warranty queries | 40/60 hybrid | CSAT, service retention |
| Telecommunications | Billing disputes, technical troubleshooting | 35/65 human-heavy | FCR, AHT |
| Aviation | Booking changes, disruption management | 30/70 human-heavy | NPS during disruption events |
| Logistics | Shipment tracking, delivery exception handling | 60/40 AI-heavy | On-time resolution rate |
Technology Ecosystem: What Powers a 2026 BPO Operation
A modern BPO stack integrates across CRM, telephony, cloud infrastructure, and generative AI layers.
| Category | Representative Platforms |
|---|---|
| CRM & Ticketing | Zendesk, Salesforce, Freshdesk, HubSpot |
| Contact Center Platforms | Genesys, Five9, Talkdesk, NICE CXone |
| Workflow & Collaboration | ServiceNow, Slack, Microsoft Teams |
| Cloud Infrastructure | Amazon Web Services, Google Cloud, Microsoft Azure |
| Generative AI Layer | OpenAI, Google Gemini, Claude, Microsoft Copilot |
| Commerce Integration | Shopify, WooCommerce |
| Payments Integration | Stripe, PayPal |
| Conversational Support | Intercom |
Why It Matters: Vendor lock-in and integration cost are frequently underestimated in BPO evaluations. A provider fluent in your existing stack (e.g., already integrated with your Salesforce or Zendesk instance) will typically go live 30–40% faster than one requiring custom integration work.
Executive Action: Ask any shortlisted vendor for a technical integration timeline against your specific stack — not a generic capability list — before signing.
Learn how this stack connects to broader operational efficiency in our guide to automating business processes.
Security & Compliance
| Standard | Relevant For | What to Verify |
|---|---|---|
| HIPAA | Healthcare | BAA agreements, encrypted PHI handling, access logging |
| PCI-DSS | Retail/eCommerce, Financial Services | Card data handling, tokenization practices |
| GDPR | Any EU customer data | Data residency, right-to-erasure processes |
| SOC 2 Type II | Enterprise SaaS/Tech clients | Independent audit of security controls |
| ISO 27001 | General enterprise data security | Certified information security management |
| RBI Guidelines | Digital banking services (India-based operations) | Data localization compliance |
Hidden Cost: Non-compliant vendors often quote lower rates because they haven’t invested in the infrastructure compliance requires. That savings disappears — and reverses into liability — the moment a data incident occurs. Compliance cost should be treated as insurance, not overhead.
Risk Analysis: What Can Go Wrong
| Risk | Likelihood | Mitigation |
|---|---|---|
| High agent attrition disrupting service continuity | High in offshore markets | Contractual backup staffing clauses, cross-training |
| Data security breach | Low but high-impact | Mandate SOC 2/ISO certification, regular audits |
| Over-automation eroding CSAT | Medium | Contractual deflection accuracy thresholds |
| Vendor lock-in with poor exit terms | Medium | Negotiate data portability and transition-out clauses upfront |
| Cultural/communication mismatch | Medium | Structured accent/communication training, pilot period before full rollout |
| Hidden fee escalation post-contract | Medium-High | Fully-loaded cost disclosure clause in MSA |
Executive Action: Build an exit clause into every BPO contract before you need one. The leverage to negotiate favorable transition terms exists at signing — not at renewal, when switching costs have already compounded.
Future Trends: 2026–2030
The trajectory of contact center outsourcing points toward deeper AI-human integration, not full automation:
- AI Agents will move from scripted bots to context-aware agents capable of multi-turn reasoning across CRM history.
- Voice Bots will approach near-human latency and tone modulation, expanding viable automation into more voice use cases.
- Agent Assist will become standard-issue, not premium, with real-time suggested responses and compliance monitoring embedded in every human interaction.
- Predictive Analytics will shift support functions from reactive ticket handling to proactive outreach before issues escalate — the operational expression of Predictable Revenue Operations™.
- Workflow Automation will connect support directly into billing, logistics, and CRM systems, closing the loop between conversation and resolution without manual handoffs.
- Conversation Intelligence will become the primary data source feeding retention modeling, product feedback loops, and revenue forecasting — cementing the Customer Intelligence Loop™, where every interaction generates reusable business intelligence rather than a disposable transcript.
- Human Escalation Models will formalize — expect contracts to explicitly define which interaction types are contractually reserved for human agents, rather than left to vendor discretion.
MasCallNet Perspective: The organizations that treat this shift as a cost story will optimize for the wrong metric. The organizations that treat it as a Contact Center Intelligence™ story — using every conversation as a data asset — will out-forecast, out-retain, and out-price competitors still thinking of support as a call center line item.
Executive Decision Tree: Should You Outsource, and How?
Is your support volume growing faster than your hiring capacity?
│
├── YES → Is the work highly regulated/compliance-sensitive?
│         ├── YES → Consider onshore or hybrid with compliance-certified offshore partner
│         └── NO  → Offshore hybrid model (India/Philippines) recommended
│
└── NO → Is your current cost-per-ticket above industry benchmark?
          ├── YES → Run Revenue Leakage Index diagnostic before any vendor conversation
          └── NO  → Focus on AI-assist layer to improve margin, defer full outsourcing
Executive Checklist Before Signing a BPO Contract
- Ran an internal Outsourcing Readiness assessment (documentation, governance, data access)
- Calculated baseline Revenue Leakage Index
- Requested fully-loaded pricing (base + tech + QA + shrinkage) from all vendors
- Verified compliance certifications relevant to your industry (HIPAA/PCI-DSS/GDPR/SOC 2)
- Reviewed live AI-assist tooling demo, not just a slide deck
- Defined which interaction types are contractually human-only
- Negotiated data portability and transition-out terms
- Set contractual deflection accuracy and repeat-contact thresholds, not just automation rate
- Confirmed named account governance and escalation ownership
- Established a 90-day performance review checkpoint tied to CSAT/FCR/AHT baselines
Frequently Asked Questions
How much does BPO customer support cost per month in 2026?
For a dedicated 10–20 agent offshore team in India, expect a fully-loaded monthly cost between $15,000 and $45,000 depending on channel mix, AI integration, and shrinkage. Onshore US/UK equivalents typically run 3–5x higher.
Is AI customer support cheaper than human support?
Yes, per interaction — AI-resolved interactions typically cost $0.10–$0.80 versus $2.50–$8.00 for human-handled voice interactions. However, AI is not a like-for-like replacement for complex or emotionally sensitive conversations, where poor automation can drive silent churn that costs far more than the savings.
What makes a BPO company one of the “best” in India?
Native AI integration into agent workflows, vertical industry specialization, transparent outcome-linked pricing, and compliance-first infrastructure — not company size alone.
Should I choose offshore or onshore customer support outsourcing?
Offshore (India/Philippines) offers 3–5x cost efficiency and strong 24/7 coverage; onshore is preferable for highly regulated, brand-critical, or extremely high-empathy interactions. Most enterprises now run a hybrid split.
How is outcome-based BPO pricing different from per-hour pricing?
Outcome-based pricing ties fees to results (resolution rate, retention, recovered revenue) rather than hours worked, aligning vendor incentives with business outcomes — but only works when the vendor has enough operational control to influence those outcomes.
What hidden costs should I watch for in a BPO contract?
Shrinkage (28–35% typical), management overhead fees, technology licensing pass-throughs, and attrition-driven retraining costs are the most commonly underestimated line items.
How long does it take to transition customer support to an outsourced provider?
Typical timelines range from 4–8 weeks for a well-documented operation to 3–4 months for complex, multi-channel, compliance-heavy environments.
Can AI fully replace a human customer support team?
No — not for any organization where complex, emotional, or revenue-sensitive conversations represent a meaningful share of volume. AI is best deployed to absorb repetitive volume, freeing human agents for higher-value interactions.
Considering Your Next Step?
If you’re comparing quotes right now and the numbers don’t add up cleanly, that’s usually a pricing-model mismatch, not a vendor problem — it’s worth running the fully-loaded cost comparison above before you sign anything.
Explore our approach to hybrid AI-human customer support outsourcing →
For Leadership Evaluating a Structural CX Investment
If your support function is currently viewed internally as a cost line rather than a revenue-protection function, that framing gap is usually the real barrier to getting outsourcing or AI investment approved at the board level — not the vendor pricing itself.
Want to See the ROI Math on Your Own Operation?
The frameworks above (Revenue Leakage Index, Cost Calculator, Revenue Acceleration Framework) are directional. Applied to your actual ticket volume, channel mix, and attrition data, they produce a specific number — not a general estimate.
Ready to Talk Specifics?
Whether you’re evaluating your first outsourcing partner or restructuring an underperforming BPO relationship, a direct conversation about your ticket volume, industry, and current cost structure will get you further than another generic proposal.
Book a consultation with MasCallNet →
Conclusion: The Real Question Behind “How Much Does BPO Cost?”
The honest answer to “how much do BPO services cost in 2026” is: it depends on what you’re actually trying to buy. If you’re buying headcount, the answer is a rate card. If you’re buying revenue protection, forecast accuracy, and a system that turns every customer conversation into usable business intelligence, the answer is a different — and more defensible — number entirely.
This is the distinction we’ve built our entire operating model around. Every framework in this guide — the Revenue Leakage Model, the Outsourcing Readiness Score, the Vendor Evaluation Matrix, the AI vs. Human allocation model — exists to help you buy the second thing, not accidentally settle for the first.
Revenue Recovery Through CX™ isn’t a philosophy we apply after the contract is signed. It’s the lens we use to price, staff, and structure the engagement from day one — because a support operation that only reduces cost is doing half its job. The other half is protecting and recovering revenue that would otherwise quietly disappear, ticket by ticket, churn event by churn event.
If you’re building your 2026 budget around outsourced customer support, AI integration, or a BPO partnership in India, run the Revenue Leakage Index and the fully-loaded Cost Calculator before you finalize a single quote. The number you end up budgeting for will likely look very different from the one on the first proposal you received — and it will be the more accurate one.