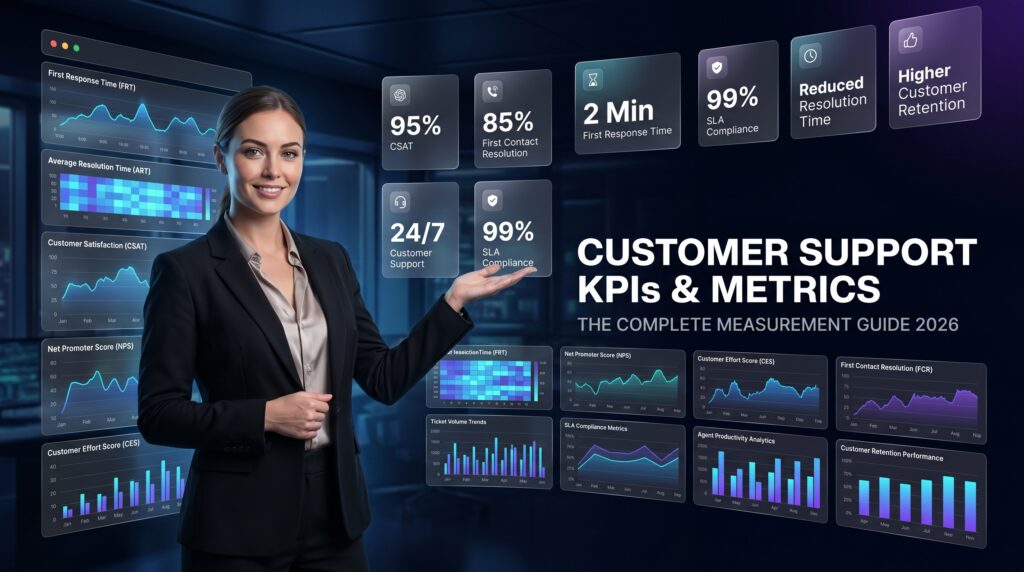
Customer Support KPIs & Metrics: The Complete Measurement Guide 2026
Customer support KPIs are the quantitative benchmarks that determine whether your support operation is delivering real business value—or quietly hemorrhaging customer loyalty. In 2026, with AI-driven contact centers, omnichannel expectations, and hyper-competitive markets reshaping customer experience, measuring the right metrics has never been more critical.
This guide covers every essential customer support KPI, what each metric means, how to calculate it, and the industry benchmarks you should aim for—giving your team a complete measurement framework for 2026 and beyond.
What Are Customer Support KPIs?
Customer support KPIs (Key Performance Indicators) are measurable values that track how effectively a support team resolves customer issues, satisfies customers, and operates efficiently. Unlike vanity metrics, true KPIs tie directly to business outcomes—retention, revenue, and brand trust.
In 2026, leading organizations use a three-tier KPI framework:
- Customer Experience KPIs — CSAT, NPS, CES
- Operational KPIs — FCR, AHT, TTR, SLA compliance
- Business Impact KPIs — Cost per ticket, churn prevention rate, CLV impact
The most effective support operations track 8–12 KPIs simultaneously, reviewed weekly at the team level and monthly at the executive level. Tracking too few leaves blind spots; tracking too many dilutes focus.
Customer Satisfaction Metrics
1. Customer Satisfaction Score (CSAT)
CSAT is the most widely used customer support metric. It captures how satisfied customers are with a specific interaction, typically measured immediately after ticket resolution via a 1–5 or 1–10 scale.
Formula: (Number of satisfied responses ÷ Total responses) × 100
2026 Industry Benchmark: 85%+ is considered good; 90%+ is excellent across most sectors.
Best practices:
- Survey within 30 minutes of ticket closure for highest response rates
- Keep surveys to 1–2 questions to avoid survey fatigue
- Segment CSAT by channel (chat vs. phone vs. email) to identify channel-specific issues
- Always follow up on CSAT scores below 3/5 with a recovery workflow
2. Net Promoter Score (NPS)
NPS measures customer loyalty and the likelihood of recommending your brand. Unlike CSAT, NPS captures long-term relationship health rather than single-interaction satisfaction.
Formula: % Promoters (9–10 score) − % Detractors (0–6 score)
2026 Industry Benchmark: +30 is good; +50 is excellent; +70 is world-class.
NPS for support teams should be measured separately from product NPS. A customer can love your product but hate the support experience—or vice versa. Isolating support-specific NPS helps identify whether CX gaps are product-driven or service-driven.
3. Customer Effort Score (CES)
CES measures how easy it was for a customer to resolve their issue. It’s a leading indicator of loyalty—low-effort experiences correlate strongly with repurchase and retention.
Survey question: “How easy was it to resolve your issue today?” (1 = Very Difficult, 7 = Very Easy)
2026 Benchmark: Aim for a CES of 5.5 or above on a 7-point scale.
CES is particularly valuable for identifying self-service friction. If customers consistently report high effort despite resolving issues through your knowledge base or chatbot, your self-service architecture needs redesign.
Efficiency & Operational Metrics
4. First Contact Resolution (FCR)
FCR measures the percentage of customer issues resolved in a single interaction—without requiring a follow-up contact. It is arguably the single most important operational KPI in customer support because it directly impacts CSAT, cost, and churn.
Formula: (Issues resolved in first contact ÷ Total issues) × 100
2026 Benchmark: 70–75% is industry average; 80%+ is considered high performance.
A 1% improvement in FCR typically reduces operating costs by 1%, making it a high-leverage metric for cost management. FCR is impacted by agent training depth, knowledge base quality, tool access, and escalation protocol design.
5. Average Handle Time (AHT)
AHT is the average duration of a customer interaction, including talk time, hold time, and after-call work (ACW).
Formula: (Talk Time + Hold Time + After Call Work) ÷ Number of interactions
2026 Benchmark by channel:
- Phone: 4–6 minutes
- Live chat: 8–12 minutes
- Email: 1–2 business days (not minutes)
AHT should never be optimized in isolation. Reducing AHT at the expense of FCR creates a false economy—customers call back, costs rise, and satisfaction falls. Pair AHT targets with FCR thresholds to ensure efficiency gains don’t compromise quality.
6. Average Speed of Answer (ASA)
ASA measures how quickly agents answer inbound contacts. Long wait times are the leading driver of poor CSAT on phone and chat channels.
2026 Benchmark:
- Phone: Under 20 seconds (80% of calls)
- Live chat: Under 30 seconds
- Email: Under 4 hours for acknowledgment
7. Time to Resolution (TTR)
TTR (also called Mean Time to Resolution or MTTR) measures the total elapsed time from when a ticket is opened to when it is fully resolved. Unlike AHT, TTR captures complex, multi-touch issues.
Formula: Sum of all resolution times ÷ Number of tickets resolved
2026 Benchmark: Under 24 hours for Tier 1 issues; under 72 hours for Tier 2; under 5 business days for complex Tier 3 escalations.
8. Abandonment Rate
The percentage of customers who disconnect before reaching an agent. High abandonment indicates insufficient staffing or excessively long queue times.
Formula: (Abandoned contacts ÷ Total inbound contacts) × 100
2026 Benchmark: Below 5% for phone; below 3% for live chat.
Agent Performance Metrics
9. Agent Utilization Rate
Agent utilization measures the proportion of time agents spend on productive work (handling contacts, ACW) versus idle or non-contact time.
Formula: (Time spent on contacts ÷ Total available time) × 100
2026 Benchmark: 75–85% for voice; 80–90% for digital channels. Over-utilization above 90% causes burnout and quality degradation.
10. Quality Assurance (QA) Score
QA scores evaluate agent interactions against a defined quality rubric—typically covering greeting, empathy, accuracy, resolution, and compliance. In 2026, AI-assisted QA tools can evaluate 100% of interactions versus the traditional 2–5% sample.
2026 Best Practice: Implement automated QA scoring for all interactions + human review for outliers (top 10% and bottom 10% of scores).
11. Schedule Adherence
Measures whether agents are available to handle contacts during their scheduled hours. Poor adherence is a leading cause of service level failures and elevated ASA.
2026 Benchmark: 90–95% adherence is the standard for high-performing contact centers.
12. Agent Satisfaction Score (ASAT)
Agent satisfaction directly correlates with customer satisfaction. Teams with high ASAT scores consistently deliver higher CSAT and lower attrition. Quarterly pulse surveys and eNPS (employee NPS) are the standard measurement methods in 2026.
Why it matters: Agent attrition costs 30–50% of annual salary per agent in recruiting and training. Measuring ASAT prevents the silent drain of high turnover.
Volume & Workload Metrics
13. Ticket Volume
Total inbound contact volume across all channels. Tracking ticket volume trends—daily, weekly, monthly, and year-over-year—is foundational for workforce planning and capacity management.
Segment ticket volume by:
- Channel (phone, chat, email, social, self-service)
- Issue category (billing, technical, shipping, account)
- Customer segment (enterprise vs. SMB vs. consumer)
- Geography and time zone
14. Ticket Backlog
The number of open, unresolved tickets at any given time. A growing backlog is an early warning indicator of capacity problems or process bottlenecks.
Best practice: Alert when backlog exceeds 110% of daily capacity. Trigger staffing escalations when backlog exceeds 125%.
15. Self-Service Deflection Rate
The percentage of potential contacts resolved through self-service channels (knowledge base, chatbot, IVR) without agent involvement.
Formula: (Self-service resolutions ÷ (Self-service resolutions + Agent-handled contacts)) × 100
2026 Benchmark: 30–50% for mature self-service programs; AI-powered chatbots in 2026 are achieving 60–70% deflection on transactional queries.
High deflection rates reduce per-contact costs significantly. AI-driven self-service can cost $0.10–$0.50 per resolution versus $5–$15 per agent-handled contact.
SLA Compliance Metrics
16. Service Level Agreement (SLA) Compliance Rate
SLA compliance measures the percentage of contacts handled within the agreed response or resolution timeframe. SLAs vary by contract, channel, and issue priority.
2026 Benchmark: 95%+ SLA compliance is the standard in enterprise support contracts. B2C consumer support typically targets 80% of contacts answered within 20 seconds.
SLA breach analysis should categorize root causes: understaffing, complex issue types, system outages, or process gaps. This enables targeted remediation rather than blanket headcount increases.
17. First Response Time (FRT)
The time between a customer submitting a ticket and receiving the first agent response. FRT is distinct from TTR and is particularly critical for email and ticketing workflows.
2026 Benchmarks by channel:
- Live chat: Under 30 seconds
- Email: Under 2 hours (business hours)
- Social media: Under 1 hour
- Phone callback: Under 10 minutes
Financial & ROI Metrics
18. Cost Per Contact (CPC)
CPC is the fully loaded cost of handling a single customer interaction, including agent wages, technology, management overhead, and facilities.
Formula: Total support operating costs ÷ Total contacts handled
2026 Benchmark by channel:
- Phone: $8–$15 per contact
- Email: $5–$10 per contact
- Live chat: $3–$8 per contact
- AI/chatbot: $0.25–$1.50 per contact
Organizations leveraging customer service automation and AI chatbots are significantly reducing CPC while maintaining or improving CSAT—the dual goal of modern support operations.
19. Support Revenue Contribution
Progressive support organizations measure how customer support contributes to revenue—through upsell, retention saves, and NPS-driven referrals. In 2026, proactive support touchpoints that prevent churn or convert trial users are tracked as measurable revenue events.
20. Customer Lifetime Value (CLV) Impact
Support quality directly impacts CLV. Research consistently shows customers who have an excellent support experience spend 17–30% more over their lifetime. Measuring CLV segmented by support experience tier (excellent, neutral, poor) demonstrates support’s financial return.
AI & Digital Channel Metrics
In 2026, AI contact centers and AI-powered contact center implementations require specialized KPIs beyond traditional support metrics.
21. Bot Containment Rate
The percentage of chatbot sessions that are fully resolved without escalating to a human agent. Higher containment rates indicate effective AI training and knowledge base coverage.
2026 Benchmark: 55–70% for mature AI deployments; 30–45% for newer implementations.
22. Bot CSAT
Customer satisfaction scored specifically for AI/chatbot interactions. This isolates AI performance from human agent performance and guides model improvement priorities.
23. Omnichannel Consistency Score
Measures whether customers receive consistent information and experience across channels (phone, chat, email, social). In omnichannel support operations, inconsistency is a top driver of poor CSAT and repeat contacts.
Building Your KPI Dashboard in 2026
A high-performing customer support KPI dashboard in 2026 should include:
Real-Time Layer (Operations Dashboard)
- Current queue size and ASA
- Active agent count vs. scheduled
- Abandonment rate (rolling 30 minutes)
- SLA compliance % (current day)
Daily Management Layer
- Ticket volume by channel and category
- CSAT scores (previous day)
- FCR rate
- AHT by channel and team
- Backlog size and trend
Weekly Performance Layer
- NPS trend
- QA average scores by team
- Self-service deflection rate
- Agent utilization and adherence
- TTR by issue category
Monthly Strategic Layer
- Cost per contact trend
- ASAT and attrition rate
- CLV impact analysis
- SLA compliance vs. contractual targets
- NPS and CES trend vs. prior quarter
Customer Support KPI Benchmarks by Industry (2026)
| Industry | CSAT Target | FCR Target | AHT (Phone) | SLA Compliance |
|---|---|---|---|---|
| SaaS / Technology | 88%+ | 75%+ | 5–7 min | 95% |
| E-commerce / Retail | 85%+ | 72%+ | 4–6 min | 90% |
| Financial Services | 82%+ | 68%+ | 6–9 min | 98% |
| Healthcare | 84%+ | 70%+ | 6–8 min | 97% |
| Telecommunications | 78%+ | 65%+ | 5–8 min | 85% |
| BPO / Outsourced Support | 86%+ | 73%+ | 4–6 min | 95% |
Enterprises that outsource customer support operations should review the top BPO performance metrics alongside these internal benchmarks to ensure vendor alignment and contractual accountability.
How to Improve Customer Support KPIs: 5 High-Impact Actions
1. Invest in Agent Knowledge Tools
Poor FCR and high AHT are frequently caused by agents spending too long searching for answers. Unified knowledge bases with AI-assisted search can reduce AHT by 20–35% while improving FCR and CSAT simultaneously.
2. Implement AI-Assisted Quality Monitoring
Manual QA samples 2–5% of interactions. AI-powered conversation analytics can evaluate 100% of contacts in real time, flagging compliance risks, coaching opportunities, and customer sentiment shifts before they escalate.
3. Redesign Your Escalation Paths
Complex escalation matrices are a primary cause of high TTR and repeat contacts. Audit your escalation structure quarterly—eliminate unnecessary tiers and empower Tier 1 agents with greater resolution authority to drive FCR improvement.
4. Close the Loop on Low CSAT Scores
Systematically following up on CSAT scores of 3/5 or below with a recovery workflow demonstrates accountability and can convert detractors into promoters. Organizations with structured recovery programs report 15–25% improvement in NPS among previously dissatisfied customers.
5. Leverage Outsourcing for Scale Without Sacrificing KPIs
Scaling support headcount internally is expensive and slow. Partnering with AI-enhanced customer support outsourcing providers allows organizations to add capacity rapidly while maintaining or improving KPI performance—particularly valuable during product launches, seasonal peaks, and rapid growth phases.
Leading BPO partners operate within contractual SLA and KPI frameworks, providing transparency and accountability that internal scaling efforts often lack. Understanding the latest call center outsourcing statistics helps set realistic KPI expectations when moving to an outsourced model.
Frequently Asked Questions: Customer Support KPIs
What are customer support KPIs?
Customer support KPIs are quantifiable metrics used to evaluate the performance, efficiency, and quality of a customer support team. The most important KPIs include CSAT (Customer Satisfaction Score), FCR (First Contact Resolution), AHT (Average Handle Time), NPS (Net Promoter Score), and SLA compliance rate. Together, these metrics provide a complete view of operational health, customer experience, and business impact.
What is a good CSAT score for customer support in 2026?
A good CSAT score for customer support in 2026 is 85% or above. Scores of 90%+ are considered excellent and are typically achieved by best-in-class support operations with strong FCR, low AHT, and effective agent training programs. Industry scores vary—financial services and healthcare typically benchmark at 80–84%, while SaaS companies often target 88–92%.
What is FCR and why does it matter?
FCR (First Contact Resolution) is the percentage of support issues resolved in a single interaction. It matters because it directly impacts customer satisfaction, operating costs, and churn. A 1% FCR improvement typically reduces costs by approximately 1% and improves CSAT by a measurable degree. Industry average FCR is 70–75%, with high-performing teams achieving 80%+.
How is Average Handle Time (AHT) calculated?
AHT is calculated as: (Total Talk Time + Total Hold Time + Total After Call Work) ÷ Number of Interactions. For phone support, the 2026 benchmark is 4–6 minutes. AHT should always be analyzed alongside FCR—reducing AHT without monitoring FCR can mask a problem where agents are ending calls prematurely, creating repeat contacts and rising costs.
How many KPIs should a support team track?
Most high-performing support teams track 8–12 KPIs simultaneously—enough to cover customer experience, operational efficiency, agent performance, and financial impact without creating metric overload. Too few KPIs create blind spots; too many dilute focus and make it difficult to identify what’s actually driving performance changes.
What KPIs should I track for AI chatbot support?
For AI chatbot support, track Bot Containment Rate (target 55–70% for mature deployments), Bot CSAT, Escalation Rate, First Response Time, and Self-Service Deflection Rate. These metrics help you assess whether your AI is genuinely resolving customer issues or simply delaying human contact—a critical distinction for CX quality.
What is the difference between CSAT, NPS, and CES?
CSAT measures satisfaction with a specific interaction. NPS measures overall loyalty and likelihood to recommend. CES measures how easy it was to resolve an issue. They are complementary—use CSAT for transaction-level quality monitoring, NPS for relationship health, and CES to identify friction in your support processes.
Conclusion: Building a KPI-Driven Support Culture
Customer support KPIs are only as powerful as the culture built around them. The most successful support organizations in 2026 don’t just measure metrics—they use them to drive continuous improvement, motivate agents with transparent performance data, and demonstrate measurable business value to executive stakeholders.
Start with the core five: CSAT, FCR, AHT, SLA compliance, and Cost per Contact. Once your measurement infrastructure is solid, expand to the full framework outlined in this guide. Review metrics weekly, act on trends monthly, and benchmark against your industry annually.
For organizations looking to scale support operations while maintaining rigorous KPI standards, AI-powered outsourcing partnerships offer a proven path to higher performance at lower cost. Whether you’re building an in-house center of excellence or evaluating outsourced models, the right KPI framework ensures you measure what matters—and act on what you find.
Ready to optimize your customer support KPIs? Explore how Mas Callnet’s AI-enhanced support solutions deliver measurable improvements across CSAT, FCR, and cost efficiency for global enterprises.