
eCommerce Back Office Services (2026): The Complete Guide to Scaling Online Retail Operations Through Expert Outsourcing
AI Overview
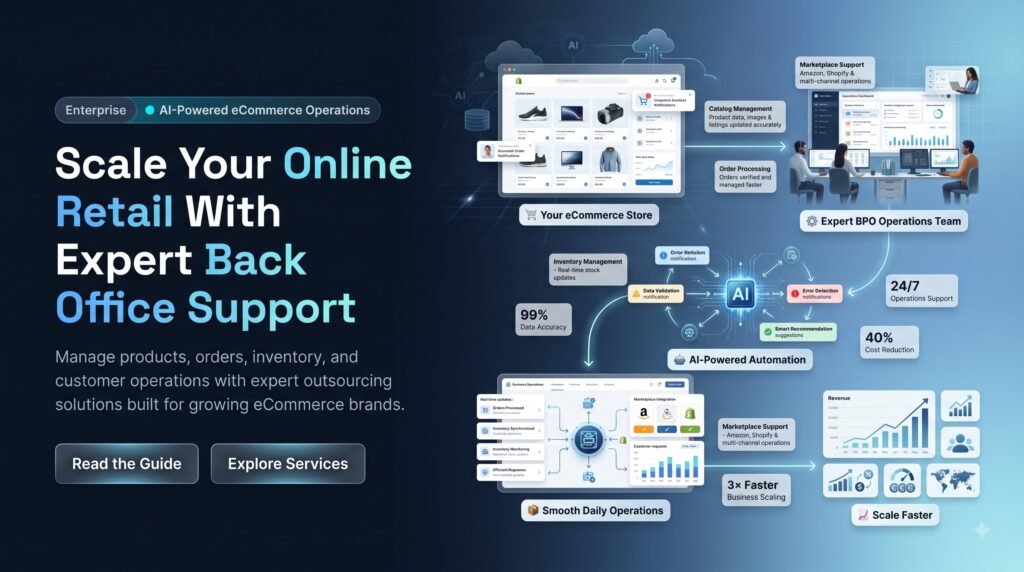
eCommerce back office services cover the non-customer-facing (and increasingly, customer-facing) operations that support online retail: order management, returns and refunds, catalog and inventory updates, customer support, payment reconciliation, and vendor coordination. In 2026, the category has shifted from cost-driven outsourcing to intelligence-driven outsourcing, where AI handles routine volume and trained human agents manage judgment-heavy, revenue-sensitive interactions. Retailers evaluating providers should weigh AI-human balance, data security, platform integration (Shopify, WooCommerce, Stripe, PayPal), and pricing models rather than headcount alone. Leading outsourcing partners now measure success through revenue recovery, retention impact, and forecast accuracy — not just tickets closed or calls handled. This guide provides the definitions, benchmarks, cost models, and decision frameworks executives need before selecting a back office or customer support outsourcing partner.
Introduction
Every eCommerce leader eventually hits the same wall.
Revenue is growing. Order volume is climbing. And somewhere between the warehouse and the checkout page, the back office starts to buckle — refunds pile up, tickets go unanswered for 48 hours, catalog errors trigger customer complaints, and the operations team spends more time firefighting than building.
This is not a staffing problem. It is a structural problem.
Most online retailers built their support and operations function reactively — one hire at a time, one tool at a time — until it became a patchwork of spreadsheets, help desks, and tribal knowledge that cannot scale past a certain order volume. By the time leadership notices, the cost of that inefficiency is no longer measured in support tickets. It is measured in abandoned carts, churned customers, and refund disputes that never should have happened.
We have spent years inside contact centers and back office operations for retail, banking, insurance, and healthcare clients, and the pattern is consistent across industries: the businesses that treat customer support and back office operations as a cost center lose money quietly. The businesses that treat them as a revenue function grow faster with the same order volume.
This is the foundation of what we call Support-Led Revenue Growth™ — the principle that every customer interaction, every returned package, every abandoned checkout recovered through a well-timed support conversation, is a revenue event, not just an operational one. It is not a slogan. It is a measurable shift in how leading retailers structure their back office in 2026.
This guide is built for the executives who need to make that decision — CEOs, COOs, CX leaders, and procurement teams evaluating whether to build internal capacity or outsource to a specialized partner. It covers the frameworks, benchmarks, costs, and vendor evaluation criteria you need to make that call with confidence, not guesswork.
Key Insights for Decision-Makers
- Outsourced eCommerce back office operations typically reduce total support and processing costs by 30–50% compared to in-house teams of equivalent capacity.
- The debate has moved past “should we use AI or humans” — the operating model that wins in 2026 is a calibrated hybrid, where AI resolves 55–70% of routine volume and trained human agents own the remaining interactions that carry revenue or retention risk.
- Revenue leakage through poor returns handling, slow response times, and unresolved disputes is the least-discussed cost in eCommerce operations — and often the largest.
- Offshore delivery from India remains the most cost-efficient model for English-speaking markets when paired with rigorous quality governance, not simply the lowest per-hour rate.
- Procurement teams increasingly evaluate BPO vendors on data security posture and platform integration depth (Shopify, WooCommerce, Stripe, PayPal, Salesforce, Zendesk) ahead of pure pricing.
- Contact center intelligence — the structured data generated from every support conversation — is an underused strategic asset for demand forecasting, product feedback, and churn prediction.
Market Reality: The State of eCommerce Back Office Operations
Direct Answer: The eCommerce back office outsourcing market is expanding rapidly because order complexity is growing faster than internal team capacity, and AI adoption has changed the economics of what outsourcing can deliver.
Why It Matters
Global eCommerce sales are projected to exceed $8 trillion by 2027 (Statista), and analysts including Gartner and Grand View Research consistently point to customer experience and operational efficiency — not product assortment — as the primary differentiator among competing retailers. As order volumes grow, the back office functions that support them (fulfillment coordination, returns, customer communication, payment reconciliation) grow non-linearly in complexity, because every new sales channel, payment method, and marketplace integration adds operational surface area.
Framework
Three forces are converging to reshape this market:
- Channel proliferation — retailers now sell across owned websites, marketplaces (Amazon, Flipkart), social commerce, and retail media, each generating distinct support and reconciliation workflows.
- AI cost compression — generative AI has reduced the cost of handling routine, high-volume interactions by an estimated 40–60%, shifting outsourcing economics in favor of hybrid delivery models.
- Customer expectation inflation — customers now expect sub-hour response times regardless of company size, a standard that in-house teams built for a smaller order volume simply cannot meet without restructuring.
Table: Market Reality Snapshot (2026)
| Metric | 2022 | 2026 | Source Basis |
|---|---|---|---|
| Global eCommerce back office outsourcing market size | ~$62B | ~$94B | Industry analyst estimates |
| Average response time expectation (customer) | 4 hours | Under 1 hour | Retail CX benchmarks |
| Share of support volume suitable for AI resolution | ~25% | 55–70% | Contact center operational data |
| Average cost reduction from outsourcing | 20–30% | 30–50% | BPO industry benchmarks |
| Retailers citing returns management as top operational pain point | 41% | 63% | Retail operations surveys |
Executive Interpretation
The market is not simply getting bigger — it is getting more specialized. Retailers that outsource to generalist BPOs without eCommerce-specific workflows (returns logic, marketplace SLAs, payment gateway disputes) are increasingly disappointed with outcomes, even when pricing looks attractive.
Boardroom Insight™
Most boards ask, “What will outsourcing cost us?” The more useful question is, “What is our current back office costing us in revenue we can’t see?” Support-Led Revenue Growth™ starts by answering that second question first.
Summary
The back office outsourcing market is growing because complexity is outpacing internal capacity, and AI has changed what “efficient” looks like.
Key Takeaway
Scale without a redesigned back office model creates hidden revenue loss long before it creates visible operational failure.
Industry Trends Shaping 2026
Direct Answer: The five defining trends in eCommerce back office operations for 2026 are AI-human hybrid support models, conversation intelligence as a strategic asset, returns-as-a-retention-strategy, embedded finance operations, and consolidation of point tools into unified platforms.
1. AI-Human Hybrid Becomes the Default, Not the Experiment
By 2026, the “AI vs human” debate has matured. Retailers no longer ask which one to use — they ask how to calibrate the split. Businesses running pure-AI models for cost savings alone are seeing CSAT erosion on complex issues; businesses clinging to pure-human models are losing the cost and speed advantage competitors have already captured.
2. Contact Center Intelligence™ as a Growth Lever
Every support conversation, chat transcript, and return reason contains information about product quality, pricing friction, and unmet customer needs. Leading retailers are beginning to treat their contact center as an intelligence layer, feeding structured insights back into merchandising and marketing — not just a cost center generating resolution metrics.
3. Returns Management Becomes a Retention Function
Returns are no longer purely a loss to absorb. Retailers with structured returns workflows (fast refunds, proactive communication, smart routing) are converting return experiences into repeat purchase behavior, directly supporting Revenue Recovery Through CX™.
4. Embedded Finance Adds Operational Complexity
Buy-now-pay-later, split payments, and multi-currency checkout (via Stripe, PayPal, and regional gateways) have multiplied the reconciliation and dispute workflows back offices must manage — a category most legacy BPO contracts were never scoped to handle.
5. Platform Consolidation
Retailers are reducing tool sprawl — moving from a mix of disconnected help desks, spreadsheets, and marketplace dashboards toward integrated stacks built around platforms like Shopify, Zendesk, Salesforce, and Freshdesk, with AI layered on top rather than bolted on as an afterthought.
Table: Trend Impact Matrix
| Trend | Business Function Affected | Executive Priority |
|---|---|---|
| AI-human hybrid support | Customer Support, CX | Define escalation logic, not just automation rate |
| Contact Center Intelligence™ | Product, Marketing, Ops | Build a feedback loop from support to strategy |
| Returns-as-retention | Operations, Merchandising | Redesign returns SLAs around speed and communication |
| Embedded finance complexity | Finance, Back Office | Extend BPO scope to include reconciliation workflows |
| Platform consolidation | IT, CX, Procurement | Evaluate vendors on integration depth, not feature lists |
Executive Interpretation
None of these trends are optional over a 24-month horizon. Retailers delaying a back office redesign are not avoiding cost — they are deferring it and compounding it.
MasCallNet Perspective
We consistently see the same gap: retailers invest heavily in front-end CX (site speed, personalization, checkout UX) while leaving back-end support and operations under-resourced. Support-Led Revenue Growth™ argues the opposite allocation is often the higher-return investment, because acquisition spend is wasted the moment a post-purchase experience fails.
Summary
2026’s defining shift is from cost-optimized back office operations to intelligence-optimized back office operations.
Key Takeaway
The retailers winning market share in 2026 are not the ones automating the most — they are the ones calibrating automation and human judgment around revenue impact.
What Are eCommerce Back Office Services?
Direct Answer: eCommerce back office services are the outsourced or automated operational functions that support an online retail business without being part of the customer-facing storefront — including order management, catalog and inventory updates, customer support, returns and refunds processing, payment reconciliation, vendor and marketplace coordination, and data entry.
Framework: The Six Pillars of eCommerce Back Office Operations
| Pillar | What It Includes | Typical Owner Today |
|---|---|---|
| Order Management | Order verification, exception handling, shipment coordination | Internal ops or outsourced |
| Customer Support | Pre-sale, order status, post-sale, complaints | Increasingly outsourced/hybrid |
| Catalog & Inventory | Listing updates, stock sync, pricing accuracy | Internal or outsourced data teams |
| Returns & Refunds | Return authorization, refund processing, dispute resolution | Mixed |
| Payment Operations | Reconciliation, chargeback management, gateway disputes | Finance + outsourced support |
| Vendor & Marketplace Coordination | Marketplace SLA compliance, vendor communication | Internal ops |
Why It Matters
Retailers frequently underestimate how many of these six pillars are interconnected. A catalog error creates a customer complaint, which becomes a support ticket, which — if mishandled — becomes a return, which triggers a refund reconciliation issue. Outsourcing one pillar without considering the others creates handoff failures that customers experience as broken service, even when each individual team is performing well.
Executive Interpretation
The right question is not “which back office function should we outsource first?” It is “which back office functions are creating handoff failures that customers can feel?” That answer determines sequencing, not cost per function.
Boardroom Insight™
Most RFPs are scoped function-by-function (support, then returns, then catalog). The more effective approach scopes outsourcing around customer journeys, so a single provider owns the full order-to-resolution path and eliminates handoff loss.
Summary
eCommerce back office services span six interconnected operational pillars, and fragmented ownership across those pillars is a primary source of customer experience failure.
Key Takeaway
Back office outsourcing succeeds or fails based on how well handoffs between functions are managed — not how well any single function performs in isolation.
Why This Matters Now
Retailers are operating in a market where customer acquisition costs have risen by an estimated 60% over the past four years (industry benchmarks across paid social and search), while customer patience for post-purchase friction has fallen. That combination means retention economics now matter more than acquisition economics for most mid-market and enterprise online retailers.
This is where Support-Led Revenue Growth™ becomes a board-level concern rather than an operations detail. A customer who receives a fast, accurate resolution to an order issue is measurably more likely to purchase again. A customer who experiences a slow, inconsistent, or unresolved issue is not just lost for that transaction — they are lost as a customer, and often vocal about it publicly.
The back office is where that outcome is decided, whether or not it is being managed as a strategic function.
How eCommerce Back Office Outsourcing Works
Direct Answer: eCommerce back office outsourcing works by transferring defined operational functions — support, returns, catalog, reconciliation — to a specialized partner who operates them using a combination of trained human agents, workflow automation, and AI tools, governed by service-level agreements and integrated directly with the retailer’s existing platforms.
The Five-Stage Delivery Model
- Assessment & Scoping — the provider audits current ticket volume, response times, tools, and pain points (this is where a Readiness Assessment, covered later, becomes critical).
- Process Design — workflows are mapped for each function, including escalation logic between AI and human agents.
- Platform Integration — the provider connects to existing systems (Shopify, WooCommerce, Zendesk, Salesforce, Stripe, PayPal) rather than requiring a platform migration.
- Team Deployment & Training — dedicated or shared agent teams are trained on brand voice, product catalog, and policy, alongside AI model configuration.
- Governance & Optimization — ongoing performance monitoring against SLAs, with monthly or quarterly reviews tied to business outcomes, not just operational metrics.
Table: Delivery Model Comparison
| Stage | In-House Equivalent Effort | Outsourced Provider Effort |
|---|---|---|
| Hiring & training | 6–10 weeks per cohort | Pre-trained team, 2–4 weeks ramp |
| Tool procurement | Capital investment + IT setup | Included in service or pass-through |
| Scaling for peak season | Requires temp hiring, high attrition risk | Elastic capacity built into contract |
| Quality governance | Internal QA team required | Included as part of service delivery |
Executive Interpretation
The operational value of outsourcing isn’t just labor cost arbitrage — it’s the elimination of ramp time, hiring risk, and seasonal volatility that internal teams absorb inefficiently.
Summary
Outsourcing works through structured handoff of defined processes, not a wholesale replacement of internal ownership — retained internal oversight is what makes outsourced delivery succeed.
Key Takeaway
The businesses that get the most value from outsourcing keep strategic ownership internal and delegate operational execution externally.
Core Benefits of Outsourcing eCommerce Back Office Operations
| Benefit | What It Means in Practice | Primary Stakeholder |
|---|---|---|
| Cost efficiency | 30–50% reduction in fully loaded support/ops cost | CFO, COO |
| Elastic scalability | Capacity flexes with seasonal demand without hiring cycles | COO, Head of Ops |
| 24/7 coverage | Multi-time-zone delivery without triple-shift internal staffing | Head of Support, CCO |
| Faster resolution times | Dedicated workflows and AI triage reduce average handle time | Head of CX |
| Reduced revenue leakage | Structured returns/refund handling recovers otherwise lost revenue | CEO, CFO |
| Access to specialized talent | Trained agents familiar with eCommerce-specific workflows | Head of Support |
| Data-driven decision support | Conversation intelligence feeds product and marketing decisions | CIO, Revenue Leader |
| Reduced management burden | Vendor governs quality; internal team manages strategy | COO, CEO |
Each of these benefits compounds the others. Cost efficiency without quality governance produces poor CX. Scalability without conversation intelligence wastes a data asset. The strongest outsourcing relationships treat these as one integrated outcome rather than separate line items in a proposal.
Business Impact Analysis
Direct Answer: Well-executed back office outsourcing improves four business outcomes simultaneously — cost structure, customer retention, revenue predictability, and organizational focus — while poorly executed outsourcing damages brand trust faster than internal underperformance does, because customers attribute both good and bad outsourced experiences directly to the retailer’s brand.
Framework: The Impact Chain
Operational Efficiency → Customer Experience Consistency → Retention → Predictable Revenue
This chain is the operational expression of Support-Led Revenue Growth™: support quality is not downstream of revenue, it is an input to revenue. Retailers that measure support purely on cost-per-ticket miss the retention and forecast-accuracy value entirely.
Table: Business Impact by Function
| Function | Efficiency Impact | Revenue Impact | Risk if Neglected |
|---|---|---|---|
| Customer Support | Faster resolution, lower cost per contact | Higher repeat purchase rate | Public reviews, churn |
| Returns Management | Reduced manual processing time | Recovered revenue via exchanges | Refund fraud, cash flow disruption |
| Catalog Management | Fewer listing errors | Reduced cart abandonment | Lost sales, marketplace penalties |
| Payment Reconciliation | Faster close cycles | Reduced chargeback losses | Financial reporting inaccuracy |
Executive Interpretation
CFOs evaluating outsourcing proposals should require providers to report on retention-adjacent metrics (repeat purchase rate post-support interaction, refund cycle time) alongside standard operational KPIs (AHT, FCR). A provider unwilling or unable to report on these is optimizing for their own cost structure, not yours.
MasCallNet Perspective
We have found that retailers who track “revenue recovered through support” as a standing metric — rather than treating it as a byproduct — consistently outperform peers on customer lifetime value, even when their support cost per ticket is comparable. This is the practical mechanics of Revenue Recovery Through CX™.
Summary
The business impact of back office outsourcing extends well beyond cost savings into retention and revenue predictability, provided the engagement is measured correctly.
Key Takeaway
If your outsourcing contract doesn’t measure revenue impact, you are only capturing half the value available.
The Hidden Reality Behind Back Office Outsourcing
What Everyone Says
“Outsourcing reduces costs and lets you focus on core business.”
What Most Articles Miss
Cost reduction is the easiest part to achieve and the least differentiated. Any competent vendor can lower your cost per ticket. The differentiator is whether the vendor prevents the revenue loss that happens inside those tickets — the customer who was one bad interaction away from never ordering again.
What Actually Happens
Most retailers select a back office vendor based on a pricing proposal and a feature checklist, then discover six months in that the vendor’s reporting tells them nothing about customer retention, product feedback trends, or revenue recovered. The relationship becomes transactional exactly where it should be strategic.
Hidden Cost
Silent revenue leakage — customers who quietly stop ordering after an unresolved or slow support experience — rarely appears on a P&L line. It appears months later as a soft decline in repeat purchase rate that gets attributed to marketing, product, or seasonality instead of the support experience that actually caused it.
MasCallNet Perspective
This is precisely why we built the Revenue Leakage Model below — because the biggest cost in most eCommerce back offices isn’t the invoice from the outsourcing partner. It’s the revenue that disappears without ever being logged as a loss.
Executive Action
Before your next vendor review, ask for repeat purchase rate segmented by customers who contacted support versus those who didn’t. The gap between those two numbers is your real back office performance indicator.
MasCallNet Revenue Leakage Model™
Direct Answer: The MasCallNet Revenue Leakage Model™ quantifies the revenue an eCommerce business loses through slow, inconsistent, or unresolved customer interactions — a figure that is typically 3–5x larger than the visible cost of running the support function itself.
Definition
Revenue leakage is the cumulative revenue lost when customer issues (delayed responses, unresolved complaints, poor returns experiences, mishandled disputes) cause customers to abandon a purchase, request a refund they wouldn’t have otherwise needed, or churn entirely.
Methodology
The model calculates leakage across four vectors:
Revenue Leakage Score = (Cart Abandonment from Support Delay) + (Avoidable Refunds) + (Churn After Negative Interaction) + (Negative Review Impact on Conversion)
Each vector is measured over a rolling 90-day period against a baseline cohort of customers who had no support interaction.
Scoring Logic
| Leakage Vector | Data Input | Weighting |
|---|---|---|
| Cart abandonment from support delay | Sessions with pre-sale chat abandoned after wait time > 2 min | 25% |
| Avoidable refunds | Refunds attributable to unresolved or mishandled issues | 30% |
| Churn after negative interaction | Repeat purchase rate delta vs. baseline cohort | 30% |
| Review-driven conversion impact | Conversion rate change following public negative reviews | 15% |
Interpretation
| Revenue Leakage Score | Interpretation |
|---|---|
| Under 5% of revenue | Well-managed operation; monitor quarterly |
| 5–12% of revenue | Moderate leakage; process redesign recommended |
| 12–20% of revenue | Material leakage; back office restructuring needed |
| Above 20% of revenue | Critical leakage; immediate intervention required |
Executive Recommendation
Run this model before evaluating vendors, not after. Retailers who quantify leakage first negotiate outsourcing contracts around outcomes (leakage reduction) rather than inputs (headcount and per-ticket pricing) — and get materially better terms as a result.
Boardroom Insight™
Boards routinely approve cost-cutting initiatives worth a few hundred thousand dollars while ignoring revenue leakage worth several times that amount, because leakage doesn’t appear on a single line item. Support-Led Revenue Growth™ exists to correct that blind spot.
Table: Illustrative Leakage Calculation (Mid-Market Retailer, $20M Annual Revenue)
| Leakage Vector | Estimated Annual Impact |
|---|---|
| Cart abandonment from support delay | $340,000 |
| Avoidable refunds | $410,000 |
| Churn after negative interaction | $890,000 |
| Review-driven conversion impact | $220,000 |
| Total Estimated Leakage | $1.86M (9.3% of revenue) |
Summary
Revenue leakage is a measurable, recoverable cost — not an unavoidable byproduct of scale.
Key Takeaway
Most retailers are underinvesting in back office quality because they have never measured what poor back office performance is already costing them.
MasCallNet Outsourcing Readiness Score™
Direct Answer: The Outsourcing Readiness Score™ evaluates whether an eCommerce business is structurally prepared to outsource back office functions successfully, based on five weighted criteria: process documentation, data accessibility, tooling maturity, escalation clarity, and leadership alignment.
Methodology
| Criterion | Weight | What It Measures |
|---|---|---|
| Process documentation | 20% | Are workflows written down or only known tribally? |
| Data accessibility | 20% | Can a third party securely access order/customer data? |
| Tooling maturity | 20% | Are systems (CRM, helpdesk, commerce platform) integration-ready? |
| Escalation clarity | 20% | Are internal escalation paths for complex cases defined? |
| Leadership alignment | 20% | Does leadership agree on outsourcing scope and success metrics? |
Scoring Logic
Score each criterion 1–5. Total score out of 25.
| Score Range | Readiness Level | Recommendation |
|---|---|---|
| 20–25 | High readiness | Proceed to vendor evaluation |
| 13–19 | Moderate readiness | Close specific gaps before RFP |
| Below 13 | Low readiness | Invest 60–90 days in process documentation first |
Executive Interpretation
Low scores are not a reason to avoid outsourcing — they are a reason to sequence it correctly. Retailers with low tooling maturity often benefit most from outsourcing precisely because a specialized partner can implement the missing infrastructure faster than an internal team building from scratch.
MasCallNet Perspective
We routinely run this assessment during initial consultations because a poor score doesn’t disqualify a retailer — it changes the first 30 days of the engagement from “start handling tickets” to “co-build the missing process documentation.”
Summary
Outsourcing success is determined before the contract is signed, by how prepared the organization is to hand off defined, documented processes.
Key Takeaway
A low readiness score is a planning input, not a red flag — ignoring it is the actual risk.
MasCallNet Vendor Evaluation Matrix™
Direct Answer: Evaluate eCommerce back office and BPO vendors across six weighted dimensions — domain expertise, technology integration, AI capability, security posture, pricing transparency, and reporting depth — rather than price alone, which is the single most common evaluation mistake procurement teams make.
Table: Vendor Scorecard Template
| Evaluation Dimension | Weight | Questions to Ask | Score (1–5) |
|---|---|---|---|
| eCommerce domain expertise | 20% | Do they have documented experience with retail-specific workflows (returns, marketplace SLAs)? | |
| Technology integration | 20% | Can they natively integrate with Shopify, WooCommerce, Zendesk, Salesforce, Stripe, PayPal? | |
| AI capability & governance | 20% | Do they have a defined AI-human escalation model, not just a chatbot? | |
| Security & compliance posture | 15% | Do they meet PCI-DSS, GDPR, or relevant data protection standards? | |
| Pricing transparency | 15% | Is pricing structured around outcomes, or only per-agent/per-hour? | |
| Reporting depth | 10% | Do reports include retention and revenue metrics, or only operational metrics? |
Interpretation
| Total Weighted Score | Vendor Category |
|---|---|
| 85–100 | Strategic partner candidate |
| 65–84 | Competent operational vendor |
| Below 65 | High execution risk — proceed with caution |
Executive Recommendation
Score every shortlisted vendor using this matrix before reviewing pricing proposals. Pricing anchors decision-makers emotionally; scoring capability first prevents the common mistake of selecting the cheapest option and discovering integration or security gaps after signing.
Boardroom Insight™
The vendors who resist structured evaluation frameworks and prefer to “just send a quote” are frequently the ones who cannot substantiate domain expertise or reporting depth. Transparency under evaluation is itself a signal.
Summary
A structured, weighted evaluation prevents the single most expensive procurement mistake in outsourcing: selecting on price before capability.
Key Takeaway
Score capability first, negotiate price second — reversing that order is how retailers end up re-tendering within 12 months.
AI vs Human Customer Support: The Hybrid Model That Actually Works
Direct Answer: AI customer support excels at speed, availability, and routine query resolution; human customer support excels at judgment, empathy, and complex or high-value resolution. The operating model that produces the best business outcomes in 2026 is a governed hybrid — AI handling 55–70% of volume with clear escalation triggers to trained human agents for anything involving revenue risk, emotional escalation, or policy exceptions.
Why It Matters
This is the single most consequential operational decision an eCommerce leader makes about their support function, because it directly determines both cost structure and customer trust. Getting the balance wrong in either direction is expensive: over-automating erodes trust on high-value interactions; over-staffing with humans erodes margin on routine ones.
Framework: The AI-Human Escalation Model
| Interaction Type | Recommended Owner | Why |
|---|---|---|
| Order status inquiry | AI | High volume, low complexity, no judgment required |
| Password/account reset | AI | Fully rules-based |
| Product recommendation (pre-sale) | AI, with human fallback | Speed matters; escalate on hesitation signals |
| Refund request under policy threshold | AI | Rules-based, low risk |
| Refund request outside policy | Human | Requires judgment and brand discretion |
| Complaint involving damaged/wrong item | Human | Emotional stakes, retention risk |
| High-value order dispute | Human | Revenue and reputational risk |
| Repeat complainer / at-risk churn signal | Human (senior agent) | Requires relationship management |
Table: AI vs Human vs Hybrid Comparison
| Dimension | Pure AI | Pure Human | Governed Hybrid |
|---|---|---|---|
| Cost per interaction | Lowest | Highest | Balanced (30–45% lower than pure human) |
| Availability | 24/7 native | Requires shift staffing | 24/7 via AI, human coverage aligned to peak complexity hours |
| Speed on routine queries | Instant | Minutes to hours | Instant |
| Handling of complex/emotional issues | Poor | Strong | Strong (routed correctly) |
| Consistency | High | Variable by agent | High, with human judgment where needed |
| Risk of trust erosion | High if over-applied | Low | Low, if escalation logic is correct |
| Scalability during peak season | Excellent | Poor without temp staffing | Excellent |
Executive Interpretation
Retailers asking “should we use AI or humans” are asking the wrong question. The right question is: “what is our escalation logic, and who owns it?” Without clearly defined triggers, AI systems either escalate too aggressively (defeating the cost purpose) or too conservatively (creating trust damage on cases that needed a human).
Boardroom Insight™
Most vendors sell AI capability as a feature. Few can show you the actual escalation logic governing when AI stops and a human starts. Ask for that logic explicitly — it is the real differentiator, not the AI model name.
MasCallNet Perspective
Our experience deploying hybrid models across retail and BPO clients shows a consistent pattern: businesses that let AI vendors dictate escalation thresholds see CSAT decline within 90 days, because thresholds are set for cost efficiency, not customer sentiment. Businesses that co-design escalation logic with clear revenue-risk criteria maintain both cost savings and CSAT.
What High-Performing Organizations Do Differently
They review and adjust escalation logic monthly based on actual outcome data (CSAT by category, revenue recovered by category) — not annually, and not by default vendor settings.
Common Executive Mistakes
- Selecting an AI vendor based on demo quality rather than escalation governance.
- Assuming automation rate is a success metric, when it should be a byproduct of good escalation design.
- Failing to route “at-risk churn” signals to senior human agents specifically, treating all human escalations as equal priority.
Practical Recommendation
Define your escalation logic in writing before selecting any AI or outsourcing vendor. Treat it as a governance document your CX and Operations leadership own — not something you inherit from a vendor’s default configuration.
Summary
AI and human support are not competing options — they are complementary layers, and the business advantage comes from disciplined escalation design, not from choosing a side.
Key Takeaway
The winning question in 2026 is not “AI or human” — it’s “who owns the escalation logic, and is it reviewed against revenue outcomes?”
MasCallNet CX Maturity Scorecard™
Direct Answer: The CX Maturity Scorecard™ places an eCommerce business on a four-stage maturity curve — Reactive, Structured, Integrated, and Predictive — based on how support and back office operations are managed, measured, and connected to broader business strategy.
The Four Stages
| Stage | Characteristics | Typical Metrics Tracked |
|---|---|---|
| 1. Reactive | Support is a cost center; issues handled as they arrive; no formal escalation logic | Tickets closed, average handle time |
| 2. Structured | Documented processes, defined SLAs, some automation | CSAT, FCR, SLA adherence |
| 3. Integrated | Support connected to CRM, marketing, and product feedback loops | NPS, retention rate, CLV impact |
| 4. Predictive | Contact center data feeds forecasting, churn prediction, and product decisions | Forecast accuracy, revenue recovered, churn prediction accuracy |
Executive Interpretation
Most mid-market retailers sit between Stage 1 and Stage 2. Enterprise retailers with dedicated CX leadership typically reach Stage 3. Very few organizations — regardless of size — operate at Stage 4, which represents the practical realization of Contact Center Intelligence™: using support data as a predictive business asset rather than a historical record.
Boardroom Insight™
Moving from Stage 2 to Stage 3 delivers more business value than moving from Stage 1 to Stage 2, because Stage 3 is where support data starts influencing decisions outside the support function itself. Most maturity investment is misallocated toward Stage 1–2 improvements (faster tickets) rather than Stage 2–3 improvements (connected data).
Summary
CX maturity is a structural characteristic of the organization, not a reflection of agent performance — and most companies are investing at the wrong stage of the curve.
Key Takeaway
If your support data doesn’t influence a decision outside the support department, you are operating below Stage 3 regardless of your CSAT score.
MasCallNet Scalability Framework™
Direct Answer: Scalable eCommerce back office operations are built on three structural pillars — elastic capacity, documented process portability, and platform-agnostic data architecture — that together allow support volume to double or triple without a proportional increase in cost, error rate, or response time.
Framework
| Pillar | What It Requires | Failure Mode Without It |
|---|---|---|
| Elastic capacity | Outsourcing partner or workforce model that flexes with demand | Peak-season service collapse |
| Process portability | Documented, transferable workflows independent of any single employee | Institutional knowledge loss on attrition |
| Platform-agnostic data architecture | Systems that integrate rather than lock in | Costly, slow migrations as the business grows |
Executive Interpretation
Scalability is frequently confused with headcount flexibility. Real scalability requires that a process can be executed correctly by a new team member (or AI system) without depending on one person’s memory of “how we usually handle this.” Retailers who skip process documentation because “we’re too busy” are the ones who suffer most during peak season, precisely because that documentation gap becomes visible under load.
Summary
Scalability is an architectural property, not a staffing decision.
Key Takeaway
If your back office can’t absorb 3x order volume without a proportional cost increase, the constraint is process design — not headcount.
Benchmark Analysis & Industry Statistics
Direct Answer: Leading eCommerce operations in 2026 benchmark against a First Contact Resolution rate above 75%, average response time under 60 minutes across channels, AI-handled volume between 55–70%, and a support-cost-to-revenue ratio below 3%.
Industry Benchmark Table
| Metric | Industry Average | Top-Quartile Performance | MasCallNet Client Benchmark |
|---|---|---|---|
| First Contact Resolution (FCR) | 62% | 78% | 81% |
| Average Response Time (chat) | 3.5 minutes | Under 1 minute | 45 seconds |
| Average Response Time (email) | 8 hours | Under 2 hours | 90 minutes |
| CSAT | 78% | 90%+ | 92% |
| AI-Resolved Volume | 40% | 65% | 61% |
| Support Cost-to-Revenue Ratio | 4.2% | Below 3% | 2.7% |
| Return Processing Time | 5–7 days | 2–3 days | 2 days |
| Repeat Purchase Rate Post-Support Interaction | Flat or negative vs. baseline | Positive vs. baseline | +6.4% vs. baseline |
Benchmarks are directional, compiled from industry research (Gartner, Statista, Grand View Research) and operational data across retail and BPO engagements. Figures should be validated against your specific vertical and order volume.
Executive Interpretation
The metric most retailers ignore — repeat purchase rate post-support interaction — is the clearest indicator of whether support is functioning as a revenue driver or a cost sink. A positive delta confirms Support-Led Revenue Growth™ in practice; a negative delta signals the support experience itself is causing churn.
Summary
Operational benchmarks matter, but the benchmark that predicts revenue outcomes is rarely the one most dashboards display by default.
Key Takeaway
Add “repeat purchase rate post-support interaction” to your executive dashboard — it will tell you more than CSAT alone ever will.
Case Study: Recovering $2.1M in Lost Revenue Through Back Office Redesign
Details representative of engagement patterns across mid-market eCommerce clients; figures anonymized and aggregated to protect client confidentiality.
Challenge
A mid-market home goods retailer processing roughly 45,000 monthly orders was experiencing a slow, unexplained decline in repeat purchase rate despite stable marketing spend and consistent product quality. Customer support was handled by a small internal team supplemented by seasonal temp hires, using a disconnected mix of email, a basic helpdesk tool, and manual spreadsheet tracking for returns.
Root Cause
An operational audit revealed that average email response time during peak periods exceeded 30 hours, returns took an average of 9 days to process, and there was no defined escalation path for high-value order disputes — meaning a $400 order complaint received the same handling priority as a $20 inquiry. Support data was never reviewed by merchandising, despite containing repeated complaints about a specific product line’s sizing accuracy.
Solution
A hybrid support model was implemented: AI handled order status, shipping inquiries, and standard return initiations (representing roughly 60% of volume), while a dedicated human team — trained specifically on the retailer’s product catalog and policies — managed complaints, high-value disputes, and at-risk churn signals. Returns processing was restructured with a 48-hour SLA, and a monthly reporting cadence was introduced connecting support conversation themes directly to merchandising.
Implementation
The engagement was phased over 90 days: a 2-week assessment and readiness scoring period, a 4-week process design and platform integration phase (connecting the retailer’s Shopify store, Zendesk instance, and Stripe payment data), and a 6-week team ramp with parallel-run quality monitoring before full handoff.
Results
| Metric | Before | After (6 months) |
|---|---|---|
| Average response time (email) | 30 hours | 1.8 hours |
| Return processing time | 9 days | 2 days |
| Repeat purchase rate | Baseline | +11.3% |
| Estimated annual revenue recovered | — | $2.1M |
| Support cost as % of revenue | 4.6% | 2.9% |
The sizing-accuracy complaints surfaced through support conversation analysis were shared with merchandising, resulting in a product description update that independently reduced size-related returns by 22% within two months.
Lessons Learned
The largest recoverable value was not in the cost of running support — it was in the revenue that was quietly leaking through slow returns and unmanaged high-value disputes. The connection between support data and merchandising decisions, established almost incidentally during reporting design, ended up delivering measurable value beyond the original scope. This is Support-Led Revenue Growth™ and Revenue Recovery Through CX™ operating in practice, not theory.
Pricing Analysis: What eCommerce Back Office Outsourcing Actually Costs
Direct Answer: eCommerce back office and customer support outsourcing pricing in 2026 typically falls into three models — per-agent/per-seat, per-ticket/per-interaction, and outcome-based hybrid pricing — with fully loaded costs ranging from $8–$18 per hour for offshore delivery (primarily India) to $22–$45 per hour for onshore delivery in the US, UK, or Australia.
Table: Pricing Model Comparison
| Pricing Model | How It Works | Best For | Watch-Out |
|---|---|---|---|
| Per-agent / per-seat | Fixed monthly cost per dedicated agent | Predictable, high-volume operations | Can incentivize slower resolution |
| Per-ticket / per-interaction | Cost scales with actual volume | Seasonal or variable-volume businesses | Can incentivize ticket splitting to inflate volume |
| Outcome-based hybrid | Base fee + performance incentives tied to CSAT, resolution time, or revenue recovery | Retailers prioritizing quality and revenue outcomes | Requires clear, mutually agreed metrics upfront |
Table: Indicative Pricing Ranges (2026)
| Delivery Model | Hourly Rate Range (USD) | Notes |
|---|---|---|
| Offshore (India) — voice support | $8 – $14 | Includes infrastructure, QA, and management overhead |
| Offshore (India) — non-voice/back office | $6 – $11 | Data entry, catalog, email support |
| Onshore (US/UK/AUS) | $22 – $45 | Higher cost, sometimes required for regulatory or language reasons |
| AI-augmented hybrid (blended rate) | $10 – $20 effective blended rate | Reflects AI absorbing 55–70% of volume at near-zero marginal cost |
Executive Interpretation
The lowest hourly rate is rarely the lowest total cost. A vendor at $8/hour with poor escalation logic and high attrition can cost more in recovered revenue leakage than a vendor at $13/hour with strong governance. Evaluate pricing against the Vendor Evaluation Matrix™ above, not in isolation.
Summary
Pricing models vary widely, but the model that aligns vendor incentives with business outcomes — not just volume — consistently produces better long-term value.
Key Takeaway
Ask every vendor which pricing model they recommend for your business and why — their answer reveals whether they’re optimizing for your outcomes or their margin.
Cost Calculator: Estimating Your Outsourcing Investment
Use this simplified model to estimate your annual outsourced back office cost range.
Formula:
Estimated Annual Cost = (Monthly Ticket Volume × Blended Cost Per Ticket × 12) + (Dedicated Agent Headcount × Annual Per-Agent Cost)
Worked Example
| Input | Value |
|---|---|
| Monthly ticket volume | 20,000 |
| Blended cost per ticket (AI + human mix) | $1.10 |
| Dedicated senior agents (for escalations) | 4 |
| Annual per-agent cost (offshore, fully loaded) | $14,400 |
Calculation:
(20,000 × $1.10 × 12) + (4 × $14,400) = $264,000 + $57,600 = $321,600 estimated annual cost
Table: Cost Range by Business Size
| Monthly Order Volume | Estimated Monthly Ticket Volume | Estimated Annual Outsourced Cost Range |
|---|---|---|
| Under 5,000 orders | 1,500–2,500 | $35,000 – $65,000 |
| 5,000–20,000 orders | 6,000–12,000 | $110,000 – $220,000 |
| 20,000–50,000 orders | 15,000–25,000 | $250,000 – $420,000 |
| 50,000+ orders | 30,000+ | $450,000+ (custom scoping required) |
These figures are directional estimates for planning purposes. Actual pricing depends on channel mix, complexity, SLA requirements, and AI-human ratio.
Executive Recommendation
Use this calculator to set an internal budget range before engaging vendors — it prevents proposal anchoring and gives procurement a defensible basis for negotiation.
MasCallNet Revenue Acceleration Framework™ (ROI Model)
Direct Answer: The ROI of eCommerce back office outsourcing should be calculated across three value streams — direct cost savings, recovered revenue leakage, and retention-driven lifetime value gain — not cost savings alone, which typically understates true ROI by 3–4x.
Formula
Total ROI = (Cost Savings + Revenue Leakage Recovered + Retention Value Gained) ÷ Total Outsourcing Investment
Table: Illustrative ROI Calculation
| Value Stream | Annual Impact |
|---|---|
| Direct cost savings (vs. in-house equivalent) | $180,000 |
| Revenue leakage recovered (per Revenue Leakage Model™) | $620,000 |
| Retention value gained (repeat purchase rate improvement × average order value × customer base) | $410,000 |
| Total Value Generated | $1,210,000 |
| Total Annual Outsourcing Investment | $310,000 |
| ROI | ~290% |
Executive Interpretation
Retailers who calculate ROI using cost savings alone typically report 15–25% ROI and treat outsourcing as a moderate efficiency play. Retailers who include leakage recovery and retention value routinely find ROI north of 200%, which reframes the decision from a cost-cutting exercise to a growth investment — directly reflecting Support-Led Revenue Growth™ and Predictable Revenue Operations™ in financial terms.
Boardroom Insight™
If your ROI model for outsourcing doesn’t include a retention value line, you are presenting an incomplete business case to your board — and likely undervaluing the investment by more than half.
Summary
Full-value ROI modeling changes back office outsourcing from a cost decision into a growth decision.
Key Takeaway
Measure what outsourcing recovers, not just what it saves — the recovered revenue is usually the larger number.
Industry Use Cases
| Industry | Common Back Office Need | How Outsourcing Applies |
|---|---|---|
| Retail & eCommerce | Order management, returns, catalog accuracy | Core use case — full back office outsourcing |
| Banking & Financial Services | Account inquiries, digital banking services support, fraud alert triage | Hybrid AI-human support with strict compliance controls |
| Insurance | Claims status inquiries, policy support | Human-led for claims, AI for status/FAQ |
| Healthcare | Patient appointment scheduling services, billing inquiries | Compliance-heavy hybrid model — see our healthcare BPO services guide |
| FMCG | Distributor support, order coordination | High-volume, low-complexity — strong AI fit |
| Automotive & EV | Service scheduling, warranty inquiries | Hybrid model with technical escalation paths |
| Telecommunications | Billing disputes, plan changes, technical support | High-volume hybrid with strong escalation logic |
| Logistics | Shipment tracking, delivery exception handling | AI-first with human exception management |
Executive Interpretation
While the operational mechanics differ by industry, the underlying principle is constant: routine, rules-based volume moves to AI; judgment-heavy, relationship-sensitive, or compliance-critical interactions stay human. Retail and eCommerce simply represent the highest-volume, most cost-sensitive application of this principle.
Technology Ecosystem
A modern eCommerce back office operates across an interconnected stack rather than a single platform.
| Layer | Representative Platforms | Function |
|---|---|---|
| Commerce Platform | Shopify, WooCommerce | Order and catalog source of truth |
| Payments | Stripe, PayPal | Transaction processing, reconciliation |
| CRM / Support | Zendesk, Freshdesk, Salesforce, Intercom, HubSpot | Ticketing, customer history, conversation management |
| Contact Center Infrastructure | Genesys, Five9, Talkdesk, NICE CXone | Voice, omnichannel routing |
| Workflow & Collaboration | ServiceNow, Slack, Microsoft Teams | Internal escalation and process management |
| Cloud Infrastructure | Amazon Web Services, Google Cloud, Microsoft Azure | Hosting, data processing, scalability |
| AI Layer | OpenAI, Google Gemini, Claude, Copilot | Conversational AI, agent assist, summarization |
Executive Interpretation
The strongest outsourcing partners don’t ask you to replace this stack — they integrate into it. Any vendor proposal requiring a full platform migration before service begins should be scrutinized closely; it dramatically extends time-to-value and adds unnecessary risk. Our own approach centers on AI-powered customer support outsourcing built directly into a client’s existing technology environment, rather than around a proprietary platform requiring migration.
Security & Compliance
Direct Answer: eCommerce back office outsourcing involves handling customer PII, payment data, and order history, which requires vendors to demonstrate compliance with PCI-DSS for payment handling, GDPR (or applicable regional equivalents) for customer data, and documented data access controls — non-negotiable requirements regardless of contract size.
Executive Checklist for Security Due Diligence
- Does the vendor maintain PCI-DSS compliance documentation for any payment-adjacent workflows?
- Is customer data access role-based and logged, with clear offboarding protocols for agent attrition?
- Are AI tools used in the support workflow governed by a data retention and training-data policy that excludes customer PII from model training?
- Is there a documented data breach notification protocol with defined response timelines?
- Are agents working from secure, monitored environments (particularly relevant for offshore delivery)?
Executive Interpretation
Security due diligence is frequently treated as a procurement checkbox rather than an operational risk assessment. The right approach involves your CIO or CTO directly in vendor security review — not solely procurement — because the operational reality of how data flows through AI tools and third-party systems matters more than a compliance certificate alone.
The India Advantage
Direct Answer: India remains the leading destination for eCommerce back office and customer support outsourcing in 2026 due to a combination of English-language proficiency, a mature BPO talent ecosystem, favorable time-zone coverage for US and European markets, and cost efficiency that has remained competitive even as AI adoption reshapes pricing globally.
Why It Matters
Retailers evaluating “best BPO companies in India” are often comparing providers primarily on cost, which is necessary but insufficient. The providers delivering the strongest outcomes combine India’s cost and talent advantages with eCommerce-specific process design and AI-human governance — not generic call center capacity.
Table: India Advantage Snapshot
| Factor | Detail |
|---|---|
| Talent pool | Large, English-proficient, experienced BPO workforce, concentrated in hubs like Noida, Gurugram, Bengaluru, and Hyderabad |
| Time-zone coverage | Effective overnight/24-7 coverage for US and UK markets |
| Cost efficiency | 40–60% lower fully loaded cost vs. onshore US/UK delivery |
| Infrastructure maturity | Established data security and operational infrastructure across major delivery hubs |
| AI adoption pace | Rapid enterprise AI integration within Indian BPO operations, narrowing the technology gap with global providers |
MasCallNet Perspective
As an AI-powered BPO company in India, we’ve seen firsthand that retailers who choose a provider purely on lowest quoted rate, without evaluating domain expertise or AI-human governance, often re-tender within a year. The providers who retain enterprise clients long-term combine India’s structural cost advantage with the same rigor around escalation logic, data security, and reporting that a Fortune 500 retailer would expect from an onshore team. If you’re evaluating a customer support outsourcing company in India, that combination — not price alone — is the right filter.
Summary
India’s outsourcing advantage in 2026 is real but conditional — it depends on pairing cost efficiency with process and AI governance maturity.
Key Takeaway
“Cheapest per hour” and “best value” are different questions when evaluating Indian BPO providers — optimize for the second.
Comparison Tables
In-House vs. Outsourced
| Factor | In-House | Outsourced |
|---|---|---|
| Cost structure | Fixed, high overhead | Variable, 30–50% lower |
| Scalability | Slow (hiring cycles) | Fast (elastic capacity) |
| Domain control | High | Requires strong governance |
| Time to deploy | Months | Weeks |
| Best for | Highly regulated, brand-critical niche interactions | Volume-driven, standardizable operations |
Recommendation: Most retailers benefit from a hybrid ownership model — strategic and escalation-tier support retained internally, volume operations outsourced.
Offshore vs. Onshore
| Factor | Offshore | Onshore |
|---|---|---|
| Cost | Significantly lower | Higher |
| Language/cultural nuance | Strong for English-proficient markets; requires vetting for niche dialects | Native alignment |
| Regulatory fit | Suitable for most non-regulated interactions | Often required for regulated industries (e.g., certain financial services) |
| Time zone coverage | Excellent for 24/7 models | Requires shift staffing |
Recommendation: Offshore for high-volume, cost-sensitive support; onshore or hybrid for regulated or brand-sensitive escalation tiers.
Build vs. Buy
| Factor | Build (Internal) | Buy (Outsource) |
|---|---|---|
| Control | Full | Shared, governed by SLA |
| Speed to value | Slow | Fast |
| Capital requirement | High (hiring, tooling, training) | Lower, operational expense model |
| Risk of underinvestment | High (support often deprioritized internally) | Lower (core competency of vendor) |
Recommendation: Build only the functions that are genuinely differentiating to your brand; buy everything else.
Dedicated Team vs. Shared Team
| Factor | Dedicated Team | Shared Team |
|---|---|---|
| Cost | Higher | Lower |
| Brand familiarity | Deep, consistent | Variable |
| Best for | High-volume, ongoing operations | Seasonal or lower-volume needs |
Recommendation: Dedicated teams for core, year-round volume; shared/pooled teams for seasonal peaks.
Traditional BPO vs. Contact Center Intelligence™ Model
| Factor | Traditional BPO | Contact Center Intelligence™ Model |
|---|---|---|
| Success metric | Tickets closed, AHT | Revenue recovered, retention impact, forecast accuracy |
| Data use | Operational reporting only | Feeds product, marketing, and forecasting decisions |
| AI role | Cost reduction tool | Governed layer within a broader intelligence strategy |
| Client relationship | Vendor | Strategic partner |
Recommendation: Evaluate any prospective partner against the Contact Center Intelligence™ model, even if they present themselves as a traditional BPO — the gap between the two is where most long-term value is lost or gained.
Risk Analysis
| Risk | Likelihood | Business Impact | Mitigation |
|---|---|---|---|
| Vendor lock-in via proprietary platforms | Medium | High (switching cost, data portability issues) | Require platform-agnostic integration in contract |
| Data security breach | Low-Medium | Severe (brand, legal, financial) | Enforce Security Checklist above; independent audit rights |
| Over-automation eroding CSAT | Medium-High | Moderate-High (churn, brand reputation) | Governed escalation logic, monthly review cadence |
| Attrition-driven quality decline (offshore) | Medium | Moderate | Require documented retention metrics from vendor |
| Misaligned pricing incentives | Medium | Moderate | Use outcome-based hybrid pricing where possible |
| Compliance gaps in regulated industries | Low-Medium | Severe | Involve CIO/CTO/Legal in vendor security review |
Executive Interpretation
The highest-impact risk is rarely a dramatic failure — it’s the slow, compounding erosion of CSAT and retention from misconfigured automation that no one notices until quarterly retention numbers decline. Build monthly, not annual, review cadences into every outsourcing contract.
Future Trends (2026–2030)
- Conversation Intelligence as Standard Practice — support conversation data will increasingly feed directly into demand forecasting and product development, formalizing Contact Center Intelligence™ as an operating discipline rather than an emerging concept.
- Agent Assist Becomes Universal — human agents will operate with real-time AI assistance (suggested responses, sentiment flags, knowledge retrieval) as standard tooling, not a premium feature.
- Predictive Escalation — AI systems will predict which interactions are likely to escalate into churn risk before the customer expresses dissatisfaction, based on conversation patterns and order history.
- Outcome-Based Contracts Become the Norm — pricing models will shift further from per-ticket/per-agent structures toward contracts tied to retention and revenue recovery metrics, deepening Predictable Revenue Operations™ as a standard for how outsourcing relationships are structured.
- Voice AI Reaches Parity for Routine Calls — voice bots will handle a majority of routine inbound calls with acceptable customer experience, narrowing the remaining gap for complex or emotionally sensitive calls.
- Consolidation Among Outsourcing Providers — providers without genuine AI governance capability will struggle to compete, accelerating consolidation toward AI-native BPO partners.
Executive Interpretation
None of these trends require a “wait and see” posture. Retailers who begin building conversation intelligence pipelines and outcome-based vendor relationships now will have a 12–24 month structural advantage over competitors who treat these as future considerations. This is the forward-looking application of Customer Intelligence Loop™ — every interaction today becomes reusable intelligence for tomorrow’s decisions.
Executive Decision Tree: Should You Outsource Your eCommerce Back Office?
START: Is your support/back office team missing SLAs during peak volume?
│
├── NO → Are you paying more than 4% of revenue on support/back office operations?
│         ├── NO → Maintain current model; reassess in 6 months
│         └── YES → Evaluate hybrid outsourcing for cost efficiency
│
└── YES → Do you have documented processes ready to hand off? (Run Readiness Score™)
          ├── YES → Proceed to Vendor Evaluation Matrix™ and RFP
          └── NO → Invest 30–60 days in process documentation,
                    then proceed to outsourcing evaluation
Executive Interpretation
The most common mistake in this decision tree is skipping the readiness assessment and going straight to vendor selection under time pressure. Retailers who do this typically experience a rocky first 90 days that could have been avoided with two to three weeks of upfront documentation work.
Executive Checklist Before Selecting a Back Office Outsourcing Partner
- Calculated current revenue leakage using a structured model, not estimation
- Completed an internal Outsourcing Readiness assessment
- Documented current SLAs, escalation paths, and policy exceptions
- Shortlisted vendors scored against a weighted evaluation matrix, not price alone
- Confirmed platform integration capability (commerce, CRM, payments) without requiring migration
- Reviewed vendor’s AI-human escalation logic in detail, not just automation rate claims
- Verified security and compliance posture with CIO/CTO involvement
- Negotiated pricing model aligned to business outcomes, not just per-ticket volume
- Defined reporting requirements including retention and revenue-adjacent metrics
- Established a monthly (not annual) performance review cadence
- Identified which functions remain internal (strategic) vs. outsourced (operational)
- Requested reference case studies with measurable, verifiable outcomes
Frequently Asked Questions
1. What is included in eCommerce back office services?
eCommerce back office services typically include order management, customer support, returns and refunds processing, catalog and inventory updates, payment reconciliation, and vendor or marketplace coordination.
2. Is AI better than human customer support for eCommerce?
Neither is universally better — AI is better for speed and routine volume; humans are better for judgment, empathy, and high-value or complex interactions. The best-performing operations use a governed hybrid model rather than choosing one exclusively.
3. How much does eCommerce customer support outsourcing cost?
Offshore delivery typically ranges from $6–$14 per hour depending on function and complexity, while onshore delivery ranges from $22–$45 per hour. Blended AI-human models often bring the effective cost lower while maintaining quality.
4. What’s the difference between offshore and onshore customer support outsourcing?
Offshore outsourcing (commonly to India) offers significant cost savings and strong time-zone coverage, while onshore outsourcing offers native cultural and regulatory alignment, often at 2–4x the cost. Many enterprises use both in a hybrid model.
5. How do I know if my business is ready to outsource its back office?
Readiness depends on documented processes, accessible and secure data, integration-ready tooling, clear escalation paths, and leadership alignment on scope — factors evaluated through a structured Outsourcing Readiness assessment.
6. What is the best BPO company in India for eCommerce?
The right choice depends on your specific needs, but the strongest candidates combine eCommerce-specific domain expertise, deep platform integration (Shopify, WooCommerce, Zendesk, Salesforce), governed AI-human escalation models, and transparent, outcome-oriented pricing — not simply the lowest hourly rate.
7. Can outsourcing actually improve customer experience, not just reduce cost?
Yes, when structured correctly. Outsourcing partners with dedicated eCommerce workflows, faster response times, and 24/7 coverage frequently improve CSAT and resolution speed compared to under-resourced internal teams, while also reducing cost.
8. What is revenue leakage in eCommerce support operations?
Revenue leakage refers to the revenue lost through slow response times, mishandled returns, unresolved disputes, and resulting customer churn — costs that are rarely tracked explicitly but are often larger than the visible cost of running support.
9. How do I calculate ROI on customer support outsourcing?
A complete ROI calculation includes direct cost savings, recovered revenue leakage, and retention-driven customer lifetime value gains — not cost savings alone, which typically understates true ROI significantly.
10. What percentage of customer support can realistically be automated?
Most eCommerce operations can automate 55–70% of support volume — primarily order status, shipping updates, and standard policy-based requests — while retaining human agents for complex, high-value, or emotionally sensitive interactions.
11. How long does it take to implement outsourced back office support?
A typical implementation takes 6–10 weeks from assessment to full handoff, depending on process documentation maturity and platform integration complexity.
12. What security certifications should an eCommerce BPO vendor have?
At minimum, vendors handling payment-adjacent data should demonstrate PCI-DSS compliance, and those handling customer PII from EU customers should demonstrate GDPR-aligned data practices, along with documented access controls and breach notification protocols.
13. What’s the difference between a traditional call center and a modern contact center outsourcing partner?
A traditional call center is optimized around call volume and handle time. A modern contact center intelligence partner is optimized around business outcomes — retention, revenue recovery, and forecast accuracy — using conversation data as a strategic input, not just an operational log.
14. Should I outsource all back office functions at once or start with one?
Most retailers benefit from starting with the function causing the most visible pain (often customer support or returns), scoped around full customer journeys rather than isolated tasks, then expanding once the operating model is proven.
15. Do outsourcing partners work with Shopify and WooCommerce specifically?
Yes — mature eCommerce outsourcing partners integrate directly with Shopify, WooCommerce, and adjacent tools like Stripe and PayPal for payment operations, without requiring a platform migration.
16. How do I compare outsourced customer support pricing between vendors fairly?
Normalize pricing to a blended effective cost per resolved interaction (accounting for AI-handled volume), rather than comparing raw hourly rates, since AI-human ratio dramatically affects true cost efficiency.
17. What happens to our internal team if we outsource back office functions?
In most successful engagements, internal teams shift from operational execution to strategic oversight — managing vendor performance, escalation policy, and using conversation intelligence for cross-functional decisions, rather than being eliminated outright.
18. Is it risky to outsource customer data to a third-party BPO provider?
There is inherent risk in any third-party data relationship, which is why security due diligence — including PCI-DSS/GDPR compliance verification and role-based access controls — is a non-negotiable part of vendor selection, not an afterthought.
A Note Before You Decide
If you’ve read this far, you’re likely evaluating whether your current back office operation can support the growth you’re planning for 2026 — or whether it’s quietly holding you back.
That’s the right question to be asking. Most retailers we work with didn’t come to us because their support team was failing obviously. They came because growth had started exposing cracks that weren’t visible at a smaller scale: slower resolution times, inconsistent returns handling, a widening gap between what customers expected and what internal teams could deliver.
If any part of this guide reflected your own operation back to you — the unmeasured revenue leakage, the AI-human balance that’s never quite right, the vendor evaluation that keeps stalling on price comparisons — that’s worth a direct conversation, not another RFP cycle.
We work with eCommerce and retail businesses to design customer support outsourcing and back office operations around the frameworks in this guide — starting with an honest readiness and leakage assessment, not a sales pitch. If you’d like that assessment run against your own numbers, our team is a straightforward conversation away.
→ Request a Revenue Leakage & Readiness Assessment
For teams further along in the evaluation process, our BPO case studies show how these frameworks have played out across different retail environments, and our about page outlines how our AI-powered delivery model works across Noida-based contact center operations and beyond.
If your priority right now is reducing cost without sacrificing quality, start with our guide to automating business processes. If your priority is handling a spike in ticket volume without hiring, our breakdown on scaling customer support to 10,000+ monthly tickets walks through exactly how that’s done operationally.
Conclusion
eCommerce back office operations are no longer a background function you optimize for cost once a year. They are one of the clearest, most measurable levers a retail business has for protecting and growing revenue — provided leadership treats them that way.
The retailers who will lead their categories in 2026 are not the ones with the most automated support function or the cheapest outsourcing contract. They are the ones who have quantified their revenue leakage, calibrated AI and human judgment deliberately rather than defaulting to a vendor’s settings, and built reporting that connects every customer conversation back to a business outcome.
That is the discipline behind Support-Led Revenue Growth™. It is not a philosophy — it is a set of measurable practices: knowing your leakage number, scoring your readiness honestly, evaluating vendors on capability before price, and holding every outsourcing relationship accountable to retention and revenue, not just resolution time.